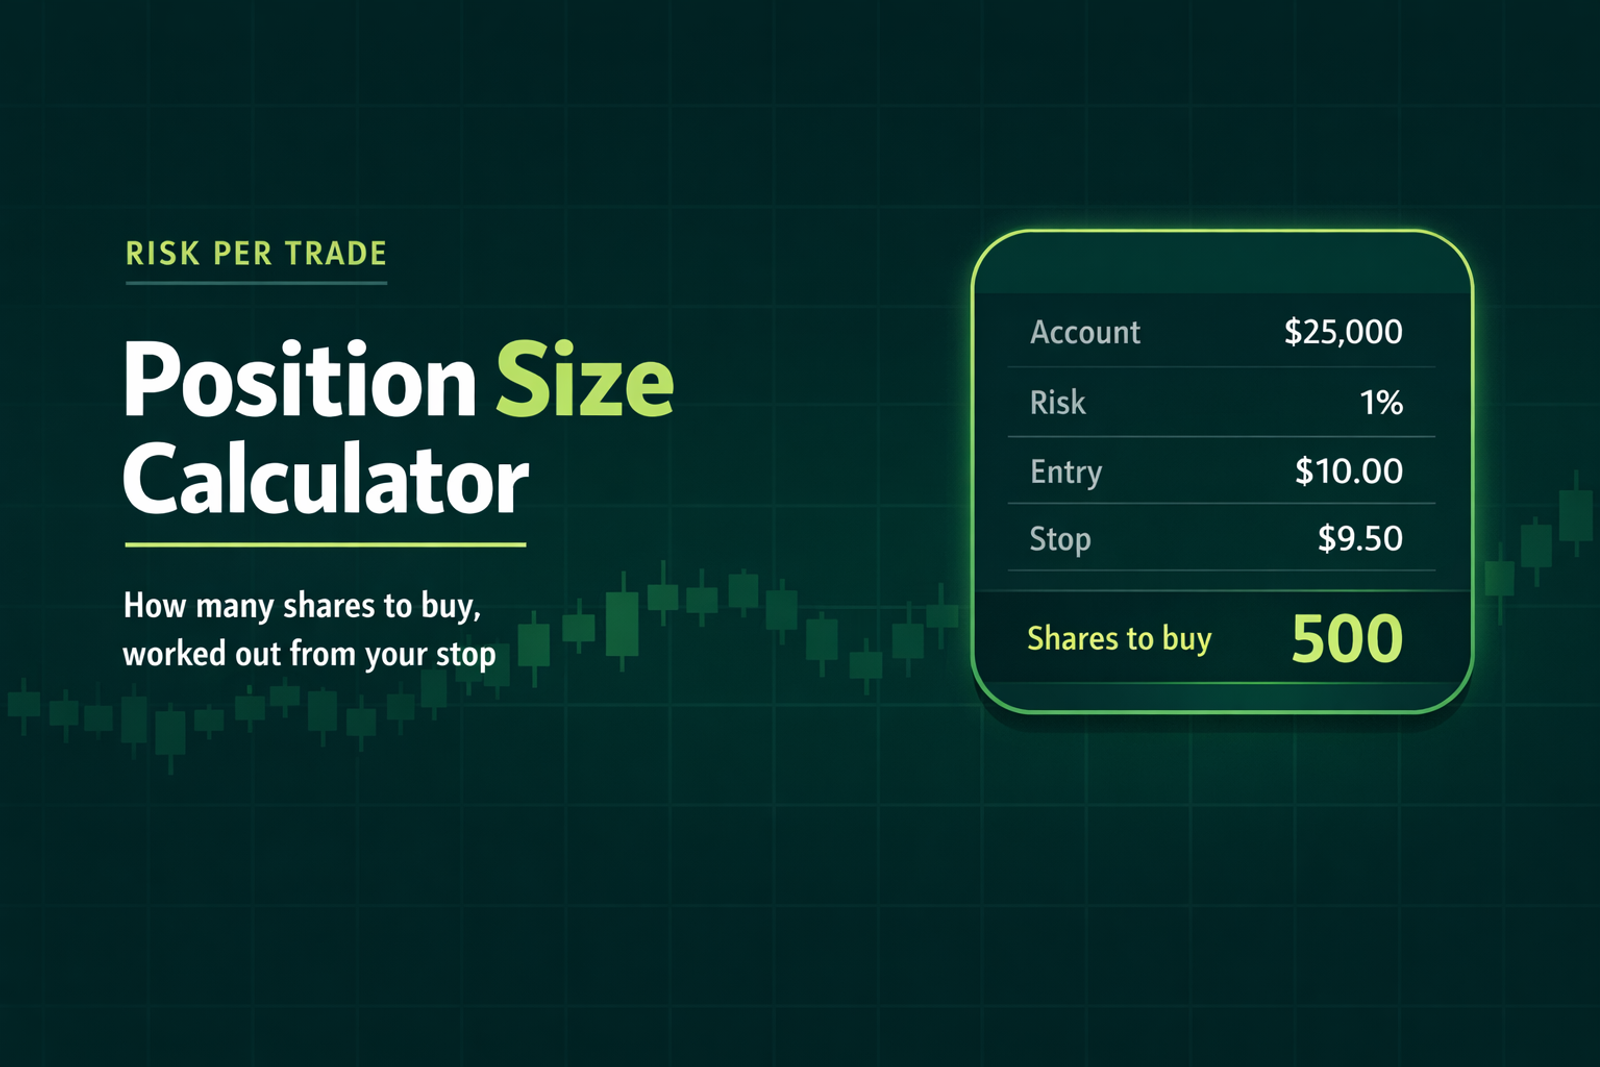
Short answer: Position size is your dollar risk divided by your risk per share. Multiply your account by your risk per trade (Momentum's rule is 1%), divide by your entry minus your stop, and round down to a whole share. A $25,000 account at 1% risk, with a $10.00 entry and a $9.50 stop, gives $250 ÷ $0.50 = 500 shares.
Position size calculator
Shares to buy500
- Planned loss at the stop
- $250.00
- Risk per share
- $0.50
- Position value
- $5,000.00 (20% of account)
- Target
- $11.00
- Reward at the target
- $500.00
- Reward to risk
- 2:1
- Win rate to break even
- 33.3%
Shares are rounded down to a whole share. A stop is not guaranteed: a gap or a halt can fill past it. Examples only, not advice.
Enter your Account size, Risk per trade, Entry price and Stop price, and the calculator returns Shares to buy and Planned loss at the stop. Target price is optional: leave it blank and the calculator sets one at 2:1.
How do you calculate position size?
Shares to buy = (Account size × Risk per trade) ÷ (Entry price minus Stop price), rounded down to a whole share. Three steps, using the calculator's opening example:
- Set your dollar risk. Account size × risk per trade. $25,000 × 1% = $250.
- Find your risk per share. Entry price minus stop price. $10.00 minus $9.50 = $0.50.
- Divide and round down. $250 ÷ $0.50 = 500 shares.
Charles Schwab's trade-plan guide works the same formula with $750 at risk and $10 between the entry and the exit: "$750 / $10 = 75 shares." Momentum's risk management guide writes it as one line: "Position Size = (Account Risk $) ÷ (Risk Per Share)."
Always round down. If your dollar risk is $100 and your risk per share is $0.17, $100 ÷ $0.17 = 588.2, so you buy 588 shares. At 589, the planned loss would be $100.13, over your limit.
The full hypothetical example:
The position is worth $5,000. The stop is what sets the planned risk at $250.
Why risk 1% per trade?
Momentum teaches the 1-2-3 rule. The trading room page states it like this: "The 1-2-3 rule: risk no more than 1% of the account, never enter without 2:1, and stop for the day after 3 losses."
Kevin Cabana, who runs the Momentum trading room and goes by Kev, puts his own limit in the first person: "My ceiling for a single trade is 1% of the account." IG Academy's guide figure is also 1%: "As a guide, many traders wouldn’t risk more than 1% of their account equity on a single trade."
That's why the Risk per trade field starts at 1% and warns you if you go above it.
Shares to buy is a ceiling
The calculator gives you the most shares that keep the planned loss at the stop at or under the risk you enter, 1% by default. You can always take fewer.
Momentum's psychology post makes the same point with a $0.50 stop: "Size from the risk. If you risk 1% of your account and your stop is $0.50 away, your share size comes from that $0.50. How confident you feel doesn't change it."
Kev doesn't size up because he feels strongly about a trade or after a loss, and he trades thin floats (stocks with few shares available to trade) with smaller size. He puts it this way: "My position size stays basically constant, because oversizing on a trade you feel strongly about is exactly how the outlier blowups happen."
What reward to risk do you need?
At least 2:1. Reward to risk is the target minus the entry, divided by the entry minus the stop. In the example, ($11.00 minus $10.00) ÷ $0.50 = 2, so 2:1. To find a 2:1 target on a long trade, add twice your risk per share to the entry: $10.00 + $1.00 = $11.00.
The calculator measures to one target, warns you below 2:1 and shows the win rate you'd need to break even. Momentum's pullback trading guide gives the formula: "Before costs, your breakeven win rate is 1 divided by (1 + your average reward to risk)."
These are computed floors. They assume every win and every loss is the full planned size, and they leave out costs. A ratio describes the trades you take. It says nothing about how often any trader wins.
What happens after 3 losses?
The 1-2-3 rule ends the day at the third loss. On the $25,000 example, three planned losses of $250 cost $750, or 3.0% of the account. If you resize after each loss at 1% of the new balance, it's 2.97%.
The table is computed. It assumes fixed-fraction sizing (each loss is 1% of the current balance) and stops filling at your price. It can't tell you how often a streak happens.
Kev's posts add a daily max loss on top: "Daily max loss: set it before the open, for example three times your per-trade risk, and close the platform when you hit it." The first-account guide has the longer streak table.
Why can you lose more than the calculator shows?
Planned loss at the stop is the number if the stop fills at your price. A stop doesn't guarantee your exit price.
Investor.gov, the SEC's investor site, spells out how a stop works: "When the stop price is reached, a stop order becomes a market order." It adds that "the price at which your trade is executed may differ from the stop price, especially in a fast-moving market where stock prices can change rapidly."
Say the $9.50 stop in the example fills at $9.40. The loss is 500 × $0.60 = $300, which is 1.2% of the account, above the planned 1.0%.
Halts are the other trap. FINRA describes what happens during one: "While the halt is in effect, brokerage firms are prohibited from publishing quotations or indications of interest and from trading the stock." Your stop can't fill during a halt, and the stock can reopen below it.
A stop-limit order turns into a limit order, which brings a different risk. FINRA Regulatory Notice 16-19 warns that with a stop-limit "there is the possibility that the order will not be executed at all."
Kev treats his stop as "a pre-planned price to get out at fast," and he manages it closely. The stop-loss guide covers gaps and slippage in more detail.
What if the position is bigger than your account?
Tight stops on cheap stocks can produce a share count you can't pay for. Take a $2,000 account at 1%, so $20 of risk. Entry $3.50, stop $3.48, $0.02 per share. $20 ÷ $0.02 = 1,000 shares, a $3,500 position. That's 175% of the account, and the calculator flags it.
Whether you can buy it depends on your account. In a cash account, you pay the full amount for what you buy. A margin account can borrow, and the SEC's glossary warns: "Margin increases investors’ purchasing power, but also exposes investors to the potential for larger losses." The cash vs margin guide walks through both.
If the size doesn't fit, skip the trade or take fewer shares. Kev skips it: "If I can't afford the size, I skip the trade." Fewer shares also keeps the planned loss under 1%. The tools guide is blunt about the one thing to avoid: "Never widen the risk to fit the trade."
What are the most common position sizing mistakes?
- Sizing by what you can afford. The stop sets the size. Buying power decides whether that size fits.
- Rounding up. One extra share can push the planned loss over 1%.
- Moving the stop after you size. Your share count was built on that stop. Widen it and the risk grows past your limit.
- Sizing up after a loss. The revenge-trading guide explains why it hurts: it "puts your biggest bet on your worst state of mind."
- Treating the planned loss as a guaranteed loss. It assumes the stop fills at your price.
Frequently asked questions
How do you calculate position size for day trading?
Divide your dollar risk by your risk per share and round down. At 1% of a $25,000 account, the dollar risk is $250. With a $10.00 entry and a $9.50 stop, that's $250 ÷ $0.50 = 500 shares.
How much should I risk per trade?
Momentum's rule is 1% of your account on a single trade. Kev calls it his ceiling, and IG Academy gives 1% as its guide figure too.
How do you calculate the risk-reward ratio?
Divide the distance to your target by the distance to your stop. On a long trade, that's (target price minus entry price) ÷ (entry price minus stop price). A $10.00 entry, a $9.50 stop and an $11.00 target give $1.00 ÷ $0.50 = 2, so 2:1.
What is a good risk-reward ratio?
Momentum's minimum is 2:1, part of the 1-2-3 rule. At 2:1, the break-even win rate is 33.3% before costs. That's arithmetic about the ratio and says nothing about results.
Does a stop-loss cap my loss at the planned amount?
No. FINRA says "Stop prices are not guaranteed execution prices." A gap, a fast market or a halt can mean a fill below your stop, so the real loss can exceed the number in the calculator.
What is the 3-5-7 rule in trading?
It's an informal guideline: at most 3% of the account on one trade, at most 5% across all open trades and winners of at least 7%, one of four readings of the 7. That 3% is triple the 1% IG Academy gives as a guide. The 3-5-7 rule guide compares it with the 1-2-3 rule.
Watch the entry and the stop called live
Every morning Kev trades live on stream in the Momentum trading room and calls out his entry and his stop as he takes each trade, so you can see the thought process behind every decision. In his words: "Your size stays your decision." Membership includes the live stream and its recordings, the Momentum Scanner, the Momentum Journal, the nightly and pre-market watchlists, and a position size calculator and trading simulator. You can start with a 7-day free trial. Cancel anytime.
This content is for educational purposes only and is not financial advice. Trading involves significant risk and may not be suitable for all traders.