Failed Breakout Trading: How to Capitalize on False Moves
.webp)
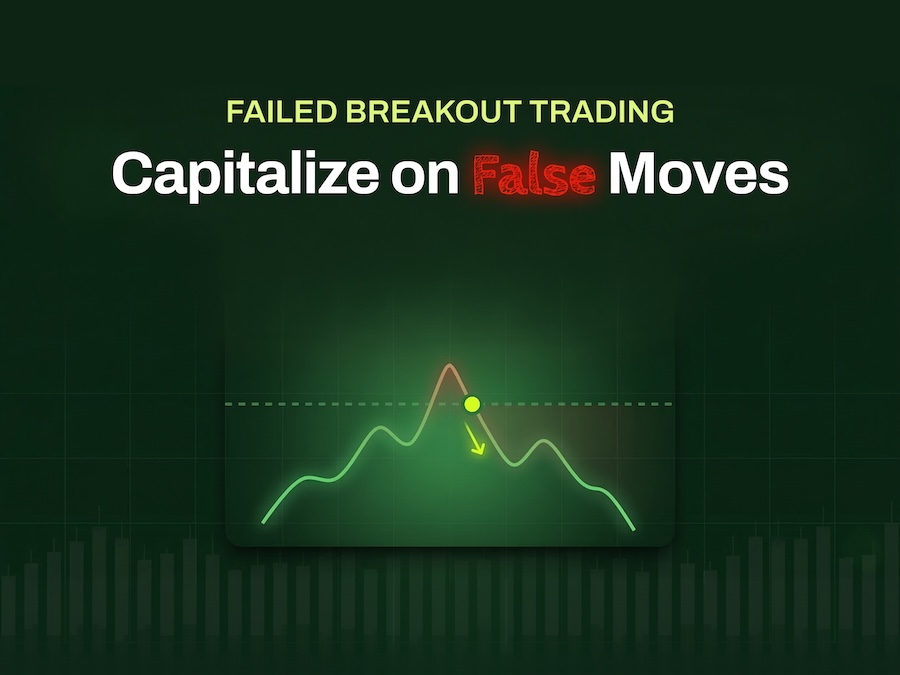
Most traders lose money on breakouts not because they read the chart wrong, but because they enter at exactly the moment the market is about to reverse on them. Studies show that up to 80% of breakouts fail, trapping momentum traders on the wrong side of the move. This guide shows you how to stop being the one who gets trapped and start being the one who profits from it.
In brief
- A failed breakout only becomes a tradable setup after the market proves the failure. Entering early, before confirmation, is the most common and costly mistake traders make.
- The best failed breakout setups happen at obvious, widely-watched levels during high-volume windows. Midday chop produces noise, not signal.
- Volume tells you commitment, not direction. A spike with no follow-through is a warning sign, not a green light.
- Before entering any reversal, map the "room to run." If the next major level is too close to justify a 2:1 reward-to-risk, skip the trade entirely.
Failed Breakout Trading Basics (False Breakout Explained)
A failed breakout follows a specific sequence: price breaks through a key level, appears to confirm the move, then loses momentum, reverses back into the prior range, and moves in the opposite direction. The break itself is not the trade signal. It is the first half of a two-part event. The second half, the rejection and reversal, is where the real opportunity lives.
The mindset shift here is treating every breakout as a test rather than a confirmation. Professional traders do not ask whether price crossed a level. They ask whether price was accepted on the other side of that level. Acceptance means price holds, consolidates, and builds structure beyond the break. Rejection means price crosses, stalls, and snaps back, leaving behind a crowd of trapped traders who entered in the wrong direction. That trapped crowd becomes fuel for the reversal move.
What is a failed breakout vs. a normal pullback?
The distinction matters because confusing the two leads to very different, and often costly, decisions.
A normal pullback occurs when:
- Price breaks a level cleanly and holds above it
- Price retraces toward that level before continuing in the breakout direction
- The broken level now acts as support
- Buyers step in on the retest and the trend resumes
A failed breakout looks similar early on but diverges sharply:
- Price breaks the level but immediately re-enters the prior range
- There is no acceptance, no consolidation above the level, no defense of the break
- The move collapses back through the level with conviction, often faster than the initial breakout itself
That velocity is a tell. It signals that the breakout attracted late buyers who are now trapped, and their forced exits accelerate the reversal.
The practical test: watch what price does after the break. If it holds and builds, you are likely looking at a pullback within a valid breakout. If it snaps back through the level without pause, that is rejection, and rejection is information you can trade.
Failed breakout vs. liquidity sweep: what is the difference?
A liquidity sweep and a failed breakout share surface-level similarities but differ in mechanics and context.
A liquidity sweep is a deliberate push through a well-known level, typically a prior high, prior low, or a cluster of stop orders, designed to trigger those stops and collect liquidity before reversing. The move is sharp, often brief, and followed by an immediate reversal that leaves the level intact. Sweeps tend to happen at obvious, heavily-watched levels where stop orders are predictably stacked.
A failed breakout is broader in scope. It does not require the precision of a stop hunt and can occur at any key level where buying or selling pressure simply was not sufficient to sustain the move. The breakout fails not because of deliberate manipulation, but because the conditions for continuation were not present: no sustained participation, no acceptance, no follow-through.
In practice, the two concepts often overlap. A liquidity sweep at a major level is frequently the mechanism behind a failed breakout. What matters for trading purposes is the outcome: price re-enters the prior range, trapped traders are on the wrong side, and momentum builds in the opposite direction. Whether the cause was a sweep or simple lack of follow-through, the trade setup reads the same way.
Why failed breakouts can be higher-probability than "clean" breakouts
Clean breakouts attract the most competition. Every momentum trader, algorithm, and retail participant is watching the same level and ready to buy the break. That crowding creates two problems:
- Entries are often late and extended
- Risk-to-reward is compressed by the time most traders get positioned
You are buying strength into an uncertain outcome.
Failed breakouts offer a different kind of edge. You are not predicting the failure. You are waiting for the market to prove it. Once price breaks a level and then clearly re-enters the prior range, the failure has already happened. You are reacting to confirmed evidence, not anticipating an outcome.
The probability advantage compounds from there. Trapped traders on the wrong side create forced exits that fuel your trade. Stop orders placed above the broken level by breakout buyers now trigger as price falls back through, adding selling pressure in your direction. The setup has built-in momentum from participants who were wrong. That is a structural edge that clean breakouts simply do not offer.
Why Breakouts Fail: The Conditions Behind the Fakeout
Breakouts fail based on supply, demand, and participation, the same forces that drive every price move in the market. What feels like someone pulling the rug is almost always the result of poor context, late entries, or a setup that was never qualified to begin with.
Lack of Pressure and Participation
A breakout without sustained buying or selling interest has no structural reason to continue. When price clears a level but participation is thin, meaning volume is weak, follow-through is absent, and the move lacks conviction, the breakout is essentially hollow.
Sellers who were defending that level have not been overwhelmed. They have simply stepped aside momentarily. The moment that temporary imbalance corrects itself, price snaps back, and traders who chased the break are left holding a losing position.
A single volume spike on the breakout candle means very little if the candles that follow show hesitation, overlapping ranges, and declining interest. The market is telling you something in those moments. Professional traders watch for sustained participation after the break, not just the initial push.
Bad Location: Breaking Into Higher-Timeframe Resistance or Support
Even a technically clean breakout will fail if it is pointed directly into a wall. Location is one of the most overlooked filters in failed breakout trading, and one of the most reliable predictors of whether a move will follow through or reverse sharply.
When price breaks a level on a lower timeframe but immediately runs into major resistance or support on a higher timeframe, the odds of continuation collapse. There is simply no room for the trade to develop.
Think about what happens structurally: buyers push price through a short-term level with enough force to look convincing on a 5-minute chart, but on the daily or weekly chart, that same price is pressing against a significant supply zone that has held multiple times before. Sellers at that higher-timeframe level are ready and waiting. The breakout gets absorbed, price stalls, and the reversal begins.
Before committing to any breakout, ask one question: "If this breaks, where can it realistically go?" If the honest answer is "into the next major obstacle two points away," the trade does not exist. No space means higher failure odds, full stop.
Choppy Pre-Breakout Behavior vs. Tight Compression
What happens before the breakout matters far more than the moment price crosses the level.
Messy pre-breakout behavior signals a lack of conviction:
- Overlapping candles
- Constant fake moves in both directions
- Wide ranges that go nowhere
When neither buyers nor sellers can establish control in the buildup, the breakout that eventually emerges from that chaos is unlikely to be clean or sustained.
Tight compression signals the opposite:
- Price consolidates in a narrow range near a key level
- Volatility contracts
- Fewer false moves
When price coils like this, fuel is building. One side is quietly absorbing the other, and when the balance finally breaks, the move tends to be decisive. Choppy action drains the energy that continuation requires. Tight, controlled consolidation stores it. The pre-breakout chart is telling you the probability of success before the trade even triggers.
The Failed Breakout Checklist: How to Spot a High-Quality Failure
Not every failed breakout is worth trading. The ones that produce sharp, reliable reversals share specific characteristics. Before entering any failed breakout trade, run through this checklist systematically.
The Level: What Makes a Breakout Level Tradable
The foundation of any high-quality failed breakout is the level itself. Prior highs and lows, range edges, high-of-day and low-of-day levels, and significant higher-timeframe reference points are where failures matter most because these are the levels that attract the most participation.
An "obvious" level:
- Has been tested multiple times
- Sits at a clean structural boundary
- Is visible on at least two timeframes
If you have to squint at the chart to justify why a level matters, it probably does not matter enough for a tradable failure. The best failed breakout setups occur at levels that any experienced trader would immediately recognize without explanation.
Higher-timeframe levels carry extra weight. A failed breakout at a prior daily high or a weekly range boundary traps far more traders than a failed break of an intraday pivot. The more significant the level, the more violent the reversal potential when price cannot sustain beyond it.
Rejection Signals: Wicks, Closes, and Rapid Reclaim
Once price pushes beyond an obvious level, the rejection signal tells you whether a failure is developing. The three clearest signals are:
- Long wicks beyond the level: Shows price was rejected decisively. Buyers pushed through, found no follow-through, and were immediately overwhelmed. The longer and sharper the wick, the more aggressive the rejection.
- Candle closes back inside the range: Confirms that the breakout crowd could not hold their ground even within a single candle. More telling than a wick alone.
- Rapid reclaim: When price blows through a level and snaps back within one or two candles, it signals the breakout had no genuine pressure behind it. Trapped traders are now underwater and forced to exit, which fuels the move in the opposite direction.
Acceptance Test: Hold Above or Below vs. Immediate Fade
The acceptance test is the core confirmation concept: if price cannot accept beyond the level, the breakout is suspect. Acceptance means price holds above a broken resistance level, or below a broken support, for multiple candles, with buyers defending the new territory. When that acceptance never comes, the breakout has failed its most important test.
Watch for three trap clues during this phase:
- Fast failure: Price breaks the level and reverses within one to three candles without any consolidation above it
- Reclaim back into the range: Price does not just stall above the level, it actively retreats through it, signaling the breakout crowd is exiting
- Inability to make progress despite volume: Elevated volume on the breakout candle but price barely moves or immediately stalls. That is effort without result, a classic warning that supply is overwhelming demand
Give price a reasonable window to prove itself, typically two to four candles on your primary timeframe. If price is churning, overlapping, and failing to build higher lows above the breakout level, the failure is confirming in real time. That is the moment failed breakout trading becomes actionable.
How to Trade a Failed Breakout (Step-by-Step Execution)
Recognizing a failed breakout is only half the work. The other half, the part that actually determines whether you make money, is executing the trade with precision. You need a defined entry model, a structural stop, and a logical target map. Without all three, you are reacting to noise.
Entry Models: Aggressive vs. Conservative Confirmation
There are two primary ways to enter a failed breakout trade, and the right choice depends on your risk tolerance and how clearly the failure has confirmed itself.
The aggressive entry (reclaim entry):
- Triggers the moment price pulls back inside the range after a false breakout
- Example: price breaks above resistance, fails to hold, closes back below that level, and you enter short as price re-enters the range
- Tighter stop and better average price
- Risk: you are acting on early evidence, and price can whipsaw before the real move develops
- Best suited for traders comfortable with faster decision-making and smaller position sizing
The conservative entry (retest entry):
- Waits for the broken level to flip its role
- After price reclaims the range, you wait for a pullback back up to the former breakout level, now acting as resistance, before entering short
- Slightly worse price but dramatically higher probability that the failure is real
- Professionals who prioritize consistency over speed typically favor this approach
Neither model is universally superior. Pick one, apply it consistently, and never blend the two mid-trade out of impatience.
Stop-Loss Placement: Clear Invalidation or No Trade
Risk definition is non-negotiable. Before you think about where price might go, you must know exactly where you are wrong. If that level does not exist or is not clean, the trade does not exist either.
For a failed upside breakout traded short, the stop belongs above the high of the false breakout candle. That is the point where price proved it could sustain above resistance. If price reclaims that level with conviction, the failure thesis is invalidated.
The principle: define risk before thinking about reward. Traders who calculate potential profit first and then figure out where to stop out are setting themselves up for oversized losses and inconsistent results. Tight, structural stops also allow you to size appropriately. When you know your maximum loss per share, position sizing becomes a math problem, not a guess.
If you cannot place a stop at a level that makes structural sense, skip the trade. There will be another setup.
Profit Targets: Range Midpoint, Opposite Range Edge, and Runners
Once you are in a confirmed failed breakout trade with your stop defined, the focus shifts to managing the exit intelligently. Scale out at logical liquidity points rather than holding for a full reversal and hoping.
Target 1: Range midpoint
This is where price naturally gravitates as it retreats from the failed breakout, and where early sellers may take profits. Scale out a portion of your position here to lock in real gains and reduce emotional pressure on the remainder.
Target 2: Opposite range edge
The far boundary of the consolidation zone. This is where trapped breakout buyers are fully underwater and where the bulk of the reversal move typically exhausts itself.
Runners:
Let structure guide the exit. Trail your stop beneath each successive lower high in a short trade as price works toward and potentially through the opposite range boundary. The moment price starts overlapping candles or stalling without progress, the edge is gone and the runner should be closed.
The targeting logic is always about mapping liquidity, not predicting a perfect reversal. Scale at the levels where other traders are forced to act, and you will consistently exit into real demand.
Volume, Momentum, and Participation Signals in Failed Breakout Trading
Volume confirms intent, not direction
A massive surge in volume on a breakout candle means nothing if price stalls, churns, and reverses within the next two bars. What that spike reveals is urgency, and urgency at the wrong moment is a warning, not a green light.
A late volume spike, one that arrives after price has already extended significantly beyond a key level, frequently signals exhaustion rather than strength. Trapped breakout buyers are piling in emotionally, not strategically. When you see rising volume with no meaningful price progress, sellers are absorbing every buy order. The effort is there. The result is not. That mismatch is one of the clearest participation signals available to traders hunting failed breakout setups.
Sustained participation vs. a single spike
The difference between a breakout that deserves to run and one that is about to reverse often comes down to what happens in the candles after the initial break.
- Sustained participation: Steady volume accompanying smooth continuation candles and shallow pullbacks. Indicates genuine interest.
- A lone spike followed by declining volume and stalling price: A red flag that the move lacked real conviction.
When price breaks a level on a burst of volume but then immediately sees volume dry up and price fail to accept above that level, you are watching a false move unfold in real time. The breakout attracted attention, triggered entries, and then ran out of buyers. The traders who bought that spike are now trapped, and their eventual exits fuel the reversal you are positioned to capture.
Price efficiency: smooth follow-through vs. erratic chaos
A violent, whipsaw reversal can feel like confirmation, but it is often the least tradable version of the setup. Erratic behavior in both directions signals instability and competing pressure, making it extremely difficult to define risk cleanly or hold a position with confidence.
The reversals that tend to offer the highest-quality opportunities are actually the quieter ones. When price reclaims a broken level calmly, holds on low volatility, and begins building structure on the other side, that is a sign of genuine shift in control. The calm reclaim suggests sellers are not panicking and buyers are not chasing. The market is efficiently repricing.
These controlled reversals give you a logical invalidation point, a clear entry area, and a manageable stop. The explosive whipsaws may look more dramatic, but the smooth, deliberate reclaims are where the edge actually lives.
Market Context Filters: When Failed Breakouts Work Best (and Worst)
The setup itself is only half the equation. The environment surrounding it determines whether you are capitalizing on a genuine trap or walking into one yourself. Selectivity is the entire edge here.
Trend-Aligned vs. Countertrend Failures
The single most reliable filter for failed breakout trading is trend alignment.
Trend-aligned failures (highest probability):
- A breakout attempts to push counter to the prevailing direction, stalls, and reverses back in line with the trend
- The existing trend acts as a tailwind
- Trapped traders on the wrong side accelerate the move in your favor
- Give the trade more room and target a larger move
Countertrend failures (lower probability, faster management required):
- You are fading a failed breakout that goes against the dominant pressure
- The reversal may still happen but tends to be shallow, choppy, and quick to reverse again
- Treat these as scalps, not swing opportunities
- Tighten your stop, reduce your size, and take profits faster than you normally would
Time-of-Day Considerations
Timing matters as much as direction.
Morning session (first 30 to 90 minutes after open):
- Volume is elevated, participation is real
- When a level fails during this window, the trapped traders are numerous and motivated
- A false breakout above the opening range high at 9:45 AM has genuine fuel behind the reversal
Midday (roughly 11:30 AM to 2:00 PM):
- Volume dries up and the market enters its notorious chop zone
- Fake patterns multiply, not because of trapped traders, but because thin conditions cause price to drift through levels without conviction
- A breakout that fails during midday chop is often just noise, not signal
- Apply a much higher standard before committing capital during this window
Prioritize failed breakout setups during high-volume windows. The failed breakout trader who does not account for time of day will find themselves on the wrong side of fakes just as often as the breakout chasers they are trying to fade.
"No Space" Scenarios: Nearby Levels That Cap the Reversal
Even a well-timed, trend-aligned failed breakout becomes a poor trade if there is no room to run. Before entering any reversal off a false move, the first question to answer is: where can this realistically go?
If the next major support or resistance level sits only 20 to 30 cents away, or less than a 1:1 risk-to-reward ratio from your entry, the trade does not exist. Your potential reward is capped before you even click the button.
Map out the next two or three major levels in the direction of your anticipated reversal before entering. Levels to watch:
- Prior highs or lows
- Higher-timeframe resistance zones
- VWAP
- Daily pivots
If any of those levels are too close, skip the trade entirely. A failed breakout that reverses into immediate resistance is a setup that traps you the same way the original breakout trapped others. Protecting your risk-to-reward ratio is non-negotiable.
Common Mistakes in Failed Breakout Trading (and How Pros Avoid Them)
The edge in failed breakout trading does not come from spotting a breakout that looks weak. It comes from waiting for the market to prove the failure, reading risk with precision, and understanding that not every fakeout deserves the same response. Most traders who struggle with this strategy are making the same three mistakes.
Anticipating the Failure Instead of Letting It Prove Itself
The most dangerous habit is jumping in before the failure is confirmed. A breakout that looks weak is not automatically a failed breakout. It is a test. Price crossing a level and then hesitating could mean exhaustion, or it could mean the market is simply pausing before continuation.
Confirmation beats anticipation every time. In practice, that means watching for price to:
- Reclaim the broken level
- Reject it cleanly
- Show momentum shifting in the opposite direction
Only then is a position warranted. Entering the moment price stalls above resistance is a prediction, not a trade. Predictions carry undefined risk and no structural backing, which means when they are wrong, there is no logical place to exit.
The professional mindset treats every breakout as a test that must be graded before a response is warranted. Waiting for the failure to prove itself keeps you out of low-quality setups and positions you for the high-probability ones.
Chasing the First Push and Destroying Risk-to-Reward
Even when a trader correctly identifies a failed breakout, execution often falls apart because they chase the first push in the reversal direction. The moment price snaps back through a level, there is a surge of excitement, and that excitement is exactly what leads to poor entries.
By the time most traders click the button, the initial move has already extended, the stop must be placed far away to make structural sense, and the risk-to-reward ratio has collapsed.
Late entries also create emotional exits. When you enter a trade with a stop that is too wide, every tick against you feels threatening. Traders in this position tend to exit early on normal pullbacks, turning a potentially solid setup into a small loss or a scratch. The trade was right. The entry was wrong. That is a preventable failure.
The professional approach: if risk cannot be placed cleanly, the trade does not exist. A clean entry means entering near the reclaimed level, where a tight, logical stop can be placed just beyond the structure that would invalidate the setup. If that entry window has passed and price has already moved significantly, wait for the next opportunity. Do not chase.
Treating Every Fakeout the Same
Not all failed breakouts are created equal, and applying the same expectations to every fakeout is one of the most common ways traders undermine their own edge.
Range breakout failure:
- Price pushes outside a defined consolidation zone and immediately snaps back inside
- Tends to produce sharp, fast reversals because trapped breakout traders are all exiting at the same time
- Entries must be timely and targets should be set with urgency
Trend continuation failure:
- Price attempts to extend an existing trend and fails, often signaling the trend is losing steam
- Tends to produce slower, more grinding reversals
- Requires more patience and active management
Exhaustion failure:
- Occurs after extended parabolic moves
- Carries the highest potential reward but also the most volatility
- Demands tighter risk controls and faster profit-taking
Professionals adjust their tactics based on which type of failure they are trading. Trend maturity, location in structure, time of day, and broader market conditions all feed into how a failed breakout should be managed. Context changes everything.
Failed Breakout Trading Plan Template (Rules and Printable Checklist)
Pre-trade: level, context, and room-to-run map
Every failed breakout trade starts long before you click the buy or sell button. Before any position is considered, three questions must be answered with confidence:
- Is this a qualified level? The best candidates are well-defined, widely-watched levels: prior highs or lows, range boundaries, or high-of-day marks that have been tested multiple times. A level that only you can see on your chart is not a level worth trading.
- What does the broader context say? Map the higher-timeframe context. A failed breakout at a level inside a strong trend carries different weight than one forming in a choppy, directionless range. Trend-aligned failures tend to produce cleaner, faster moves. Countertrend setups require tighter management and faster exits.
- If price reverses from here, where can it realistically go? Measure the distance from the failure point to the next logical target: the opposite side of the range, a prior support cluster, or a significant structural level. If that distance does not offer at least a 2:1 reward-to-risk ratio before the next obstacle, the trade does not qualify.
During trade: confirmation, stop discipline, and scaling
The core ruleset for failed breakout trading follows a clean, repeatable sequence:
- Qualify the level
- Wait for the failure or reclaim
- Enter on confirmation
- Place the stop beyond structure
- Target the range
Confirmation is the step most traders rush. A failed breakout is not confirmed the moment price ticks back inside a level. It is confirmed when price reclaims the level with conviction and holds. Look for a close back inside the range, a rejection candle with follow-through, or a reclaim that holds on a retest.
Your stop belongs just beyond the structure that defines the failure: above the false breakout high for a short, or below the false breakdown low for a long. On scaling, consider entering your full position at confirmation and taking partial profits at the midpoint of the range, letting the remainder run to the full target.
Post-trade: review metrics to improve pattern selection
The trade ends at exit, but the learning starts there. Three metrics deserve a permanent place in your review process:
- Win rate by context: Track trend versus range environments separately. You will likely find that failed breakouts in trending markets produce cleaner follow-through. That data should directly influence how aggressively you size and how selectively you filter.
- Average R across all failed breakout trades: If your win rate looks acceptable but your average R is below 1.5, you are either exiting too early on winners or holding losers too long. Both are fixable, but only if you are measuring.
- Late entry frequency: Tag every trade where you entered after the confirmation candle had already extended significantly. A high frequency of late-entry tags is a clear signal to slow down during the confirmation phase and wait for cleaner setups.