High Volume Stock Guide for Beginners (Step-by-Step)
Volume is the number of shares traded during a given period, whether that's a single minute, an hour, or a full trading day. When a stock trades significantly more shares than usual, it's considered high volume.
.webp)
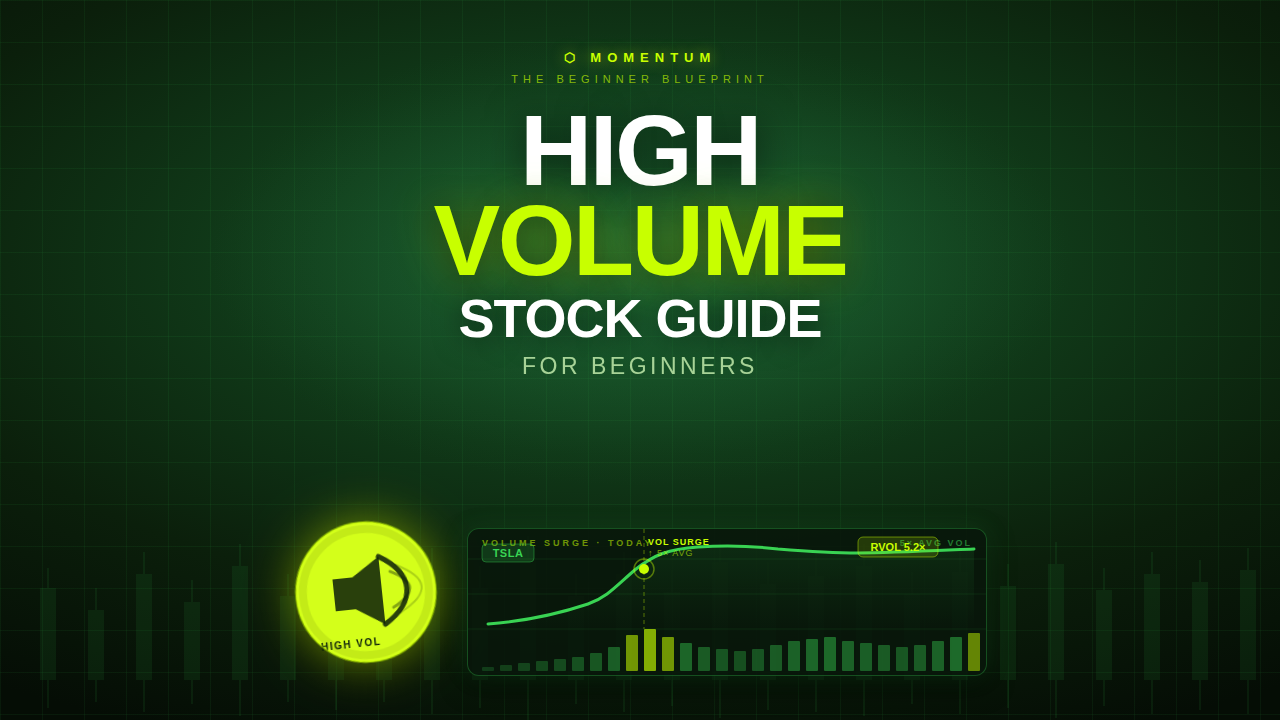
Most traders lose money in the first year, not because they lack intelligence, but because they trade the wrong stocks at the wrong time. High volume stocks are where real opportunity lives, but only if you know how to read them. This guide walks you through exactly how to find, filter, and trade high volume stocks, from premarket prep to execution, so you stop reacting and start planning.
In Brief
- High relative volume (RVOL) matters more than raw volume numbers. A stock trading 5x its normal activity is far more meaningful than a large-cap doing its routine daily volume.
- Volume confirms whether a price move is real. Breakouts on low volume fail far more often than those backed by strong participation.
- Your watchlist should have 3 to 7 names maximum, each with a clear catalyst, defined levels, and a specific reason for being there.
- Risk management is what keeps you in the game. Position sizing based on a fixed percentage of your account (1 to 2%) removes emotion from every trade decision.
What Is a High-Volume Stock?
Volume is the number of shares traded during a given period, whether that's a single minute, an hour, or a full trading day. When a stock trades significantly more shares than usual, it's considered high volume. But volume is more than a number on a chart. It drives liquidity, which determines how cleanly you can enter and exit a position.
A stock trading 10 million shares a day lets you buy or sell quickly without dramatically moving the price against yourself. That execution quality separates a real opportunity from a frustrating trap.
High Volume vs Liquidity: What Beginners Mix Up
Many beginners treat high volume and high liquidity as the same thing. They're not.
- Volume is the activity, the number of shares changing hands.
- Liquidity is the outcome, how easily you can transact at a fair price.
High volume typically produces high liquidity, but not always. In thinly traded small caps, a single large order can move the price dramatically even on a busy day.
The practical consequence of low liquidity is slippage. You place a buy order at $10.50 and get filled at $10.75 because there aren't enough sellers at your target price. For day traders making multiple entries and exits per session, that slippage compounds into a real cost. Focusing on high volume stocks is about ensuring your entries and exits happen at the prices you actually intend.
Average Volume vs Relative Volume (RVOL): Why RVOL Matters More
Here's where most beginners get tripped up. They fixate on raw average volume numbers and miss the more meaningful signal sitting right next to it.
A stock that normally trades 500,000 shares a day doing 5 million is far more significant than a mega-cap doing its routine 30 million. The former represents a dramatic shift in market participation. The latter is just another Tuesday.
That shift is what relative volume (RVOL) captures. RVOL compares a stock's current volume pace to its historical average for that same time of day, expressed as a multiple:
- RVOL of 3x means the stock is trading three times its normal activity right now, not just for the day, but at this specific hour.
- Strong setups typically show 2x to 5x relative volume.
- Low RVOL often leads to failed breakouts, choppy price action, and moves that reverse before you can react.
When scanning for opportunities, RVOL is the filter that separates genuine interest from routine noise.
When High Volume Is Bullish, Bearish, or Just Noise
Volume is context-dependent. High volume during a breakout above a key resistance level is a bullish confirmation signal. It tells you that real participation is backing the price move, not just a handful of retail orders.
But high volume can also signal the opposite. A stock surging 80% premarket on massive volume and continuing to spike at the open might look exciting. That kind of blow-off move often represents exhaustion. When everyone who wanted to buy has already bought, there's no one left to push the price higher, and the reversal can be swift.
Similarly, a stock breaking down on heavy volume confirms selling pressure. The volume itself is neutral. The price action surrounding it tells you which story is being written.
Why High Volume Matters: Liquidity, Volatility, and Better Fills
High volume affects three things that matter most to active traders: how cleanly you get in and out, how much the stock moves, and whether you can trust what the chart is showing you.
Liquidity: Tighter Spreads and Less Slippage
When a stock trades millions of shares per day, there are always buyers and sellers on both sides of the market. That tightens the bid-ask spread, which means you're not giving up unnecessary money just to enter or exit a position.
The practical impact shows up in execution. Low volume stocks force you to accept worse prices because there aren't enough participants to fill your order at the level you want. With high volume stocks, your order gets filled quickly and close to what you see on screen. For day traders making multiple entries and exits in a single session, reducing slippage on every trade compounds into a real edge over time.
Volatility: Why Volume Often Precedes Big Intraday Moves
Liquidity gets you into the trade cleanly, but volatility creates the opportunity. Day traders need price to move. Without meaningful intraday swings, there's no profit potential to capture.
High volume stocks consistently deliver those swings because increased participation drives price discovery, pushing stocks through key levels with conviction rather than grinding sideways. When a stock starts trading three to five times its average daily volume, it signals that something meaningful is happening:
- Institutional interest entering the stock
- A news catalyst attracting momentum traders
- A technical breakout drawing in new buyers
That surge in participation fuels the kind of intraday price movements that make a stock worth trading. Stocks with thin or erratic volume, by contrast, produce unpredictable whips that are difficult to trade with any consistency.
Confirmation: Using Volume to Validate Trends and Breakouts
Volume tells you whether to trust what you're seeing on the chart. Volume confirms interest. Price confirms direction. When both align, you have a high-quality signal. When they diverge, caution is warranted.
A breakout above a key resistance level on low volume is a red flag. It suggests the move lacks broad participation and is more likely to fail or reverse. The same breakout accompanied by a volume surge tells a different story: real buyers are stepping in, and the move has a higher probability of follow-through.
Research consistently shows that price moves on declining volume often signal exhaustion. Learning to read this relationship between price and volume is what separates reactive traders from prepared ones.
The Beginner's Workflow to Find High-Volume Stocks (Premarket to Open)
Most beginners open their trading platform at 9:30 AM and start reacting. The stocks they find are already extended, the moves are already crowded, and the entries are already compromised. A repeatable premarket workflow fixes this entirely.
You're not trying to pick trades instantly. You're filtering candidates methodically so that when the bell rings, you already know exactly what you're watching and why.
Step 1: Start Broad With a Scanner, Then Narrow Aggressively
Your first job in the morning is to cast a wide net, then cut it down ruthlessly. Open your scanner, tools like Thinkorswim, Webull, or Finviz work well, and filter for:
- Stocks showing premarket volume
- Significant gap movement
- Relative volume at least 3x to 5x their normal levels
This broad pass might surface dozens of names. From that initial list, start eliminating aggressively. Remove anything with thin liquidity, erratic price action, or no clear structure. A stock that's up 80% premarket on no volume and wild wicks is not a high volume stock in any meaningful sense.
Your goal is to move from a broad scan of potential movers down to a focused handful of genuine candidates. Most professional traders land on 3 to 7 names by the time the market opens. Fewer stocks means sharper focus and cleaner execution.
Step 2: Identify the Catalyst Behind the Volume Surge
Once you have a shortlist, the next question is non-negotiable: why is this stock moving? Volume without a catalyst is noise. Volume with a catalyst is opportunity.
Common catalysts to look for:
- Earnings beats or misses
- Analyst upgrades or downgrades
- FDA decisions
- Corporate actions like spinoffs or buybacks
- Sector momentum pulling a group of stocks together
A stock moving on a genuine earnings surprise will attract sustained institutional participation, follow-through buying, and real liquidity throughout the morning session. A stock moving for no identifiable reason may spike and reverse violently with no warning.
When you can articulate the catalyst in one sentence, "strong earnings gap with guidance raised," you have a stock worth keeping on your list. When you can't explain why it's moving, remove it regardless of how exciting the chart looks.
Step 3: Check the Daily Chart for Clean Structure and Room to Run
Before you ever look at an intraday chart, pull up the daily. The daily chart tells you whether a high volume stock has room to continue moving or whether it's already boxed in by overhead resistance.
A stock gapping up into a major resistance zone from six months ago is a very different trade than one breaking out into open air.
What you want to see on the daily:
- Clear support and resistance levels
- A trend or consolidation pattern that makes sense
- Space above the current price before the next supply zone
- Patterns like consolidation breakouts, bull flags, or stocks curling off a bottom with rising volume
What you want to avoid: a chart that looks like a tangled mess with overlapping candles, multiple failed breakout attempts, and no clear directional bias. If the daily chart is cluttered, the intraday trade will be guesswork.
Step 4: Mark Premarket Levels Before the Bell
The final step before the open is level-marking. For each stock that survived your filtering process, draw the following on your chart:
- Premarket high
- Premarket low
- Prior day's high
- Major daily support or resistance nearby
Each level you mark should come with a scenario attached. For example: "Long above premarket high if volume confirms and it holds on a one-minute retest." Or: "No trade if it loses premarket low at the open, that signals weakness."
This is how you build a playbook rather than a guess list. When the market opens and price starts moving fast, you won't have time to think through scenarios from scratch. The traders who execute cleanly are the ones who already know their levels, their conditions, and their invalidation points before the first candle prints.
How to Use Stock Scanners and Screeners to Spot High Volume
Stock screeners are smart filters that cut through thousands of tickers to surface only the stocks worth your attention. The right scanner setup, with the right criteria, is what separates productive morning prep from aimless clicking.
Best Free Screeners for Beginners (Finviz, Yahoo Finance)
For beginners, two free platforms stand out as reliable starting points:
- Finviz offers a visual, heat-map-style interface with a strong screener that lets you filter by volume, price change, market cap, and dozens of other criteria. Its layout makes it easy to spot patterns at a glance, which is valuable when you're still building pattern recognition skills.
- Yahoo Finance functions more as a news and data hub that also supports basic screening and watchlist creation. It's ideal for cross-referencing volume spikes with breaking news or earnings announcements, giving you context that pure scanners often miss.
Neither platform is perfect, but together they cover the two most important dimensions of high volume stock analysis: quantitative filtering and qualitative context. Screener output quality depends entirely on input criteria quality.
Core Scanner Filters: Abnormal Volume, RVOL, Gappers, % Change
Once you're inside a screener, start with these four core filters:
- Abnormal volume: A stock trading 3 to 5 times its typical daily volume signals that something meaningful is happening, whether it's news, earnings, or institutional accumulation.
- Relative volume (RVOL): A stock showing 5x or higher RVOL during the first hour of trading is a standout momentum candidate worth serious attention.
- Gappers: Stocks that open significantly higher or lower than their previous closing price, often driven by overnight news or earnings. Gappers signal a disruption in normal price behavior, and disruption creates opportunity.
- Percentage change: Look for stocks showing at least a 10% intraday price increase, which confirms that momentum is real and not just a brief spike.
Premarket Scanning: Finding Early Momentum Before the Crowd
The traders who consistently find the best setups aren't scrolling scanners at 9:31 AM. They're already done building their watchlists.
Premarket scanning, ideally starting 30 to 90 minutes before the open, gives you a calmer environment to assess which stocks have genuine momentum versus which ones are just making noise. During this window, look for:
- Strong premarket volume
- Meaningful gap activity
- A clear catalyst that explains why the move is happening
Platforms like Finviz and Yahoo Finance both support premarket data, though dedicated tools like Webull's desktop scanner and Thinkorswim's built-in scanner provide more granular premarket filtering.
The goal is to identify the 3 to 7 names that deserve your full attention when the bell rings. A stock holding premarket gains with higher lows forming is far more compelling than one that spiked once and went flat.
Common Scanning Mistakes (Overly Tight Filters, Chasing Late)
Even with the right tools, beginners consistently make two scanning mistakes:
Mistake 1: Overly tight filters from the start. Setting too many specific criteria eliminates too many legitimate candidates before you've had a chance to evaluate them. Start broad, let the scanner return a wider pool, and then manually tighten your criteria as you review the results. Broader initial scans consistently surface opportunities that rigid filters would have buried.
Mistake 2: Chasing late. By the time a stock is trending on social media or showing up in every beginner's feed, the move is often already extended and crowded. If you're entering a stock that's already up 40% on the day with no pullback, you're not trading momentum. You're trading someone else's exit. Use your scanner to find stocks before the crowd arrives, validate them with RVOL and price structure, and let the setup come to you.
How to Read Volume With Price Action (Simple Rules That Work)
Volume tells you whether to trust what price is already doing. A price move without volume backing it is like a rumor without evidence. Learning to pair these two data points together is one of the most practical skills you can develop early in your trading journey.
Volume + Breakout: What Confirmation Looks Like
When a stock breaks above a key resistance level, the volume on that breakout candle is your first signal of whether the move is real. A clean breakout on two to three times average volume is far more trustworthy than a breakout that barely registers on the volume bars.
Low volume breakouts are statistically more prone to failure. The price clears the level, but participation is thin, and without sustained buying pressure, the stock often drifts back below the breakout point. Experienced traders call this a false breakout, and it's one of the most common traps beginners fall into when they focus on price alone.
Before entering a breakout, always check whether the volume confirms the conviction behind the move.
Volume on Pullbacks: When It Signals Strength vs Weakness
Not all pullbacks are created equal, and volume is the clearest way to tell them apart:
- Pullback on lower volume after a strong advance: A healthy sign. Sellers aren't aggressive, and the path of least resistance remains upward. This is the controlled pattern experienced traders look for in continuation setups.
- Pullback on heavy, surging volume: A warning. That kind of selling pressure suggests real distribution. Larger players may be exiting positions, and the pullback could be the beginning of a more significant reversal.
- Erratic volume during a pullback: Signals uncertainty. Stay cautious.
Clean structure with consistent, readable volume is always preferable to a choppy, unpredictable tape.
Volume Spikes: Climax, Exhaustion, and Trap Risk
The biggest volume candle on a chart is not always a green light. In fact, it's often a warning.
When a stock has been trending strongly and suddenly prints a massive volume spike, often two to five times larger than anything seen in the prior move, that can signal a volume climax. It means the last wave of buyers has rushed in all at once, and there may be nobody left to push the price higher.
This exhaustion pattern frequently precedes sharp reversals. The stock looks most exciting right at the moment it's most dangerous. Volume spikes can also create traps where retail traders pile in on the excitement, only to watch the stock reverse immediately as early buyers take profits into that demand.
Treat unusually large volume candles with skepticism until price action confirms the direction.
Candlesticks + Volume: Quick Visual Checks Beginners Can Use
Candlestick patterns become significantly more meaningful when you layer volume underneath them:
- Bullish engulfing candle closing near its high on above-average volume: A much stronger signal than the same candle on light volume.
- Long upper wick rejection candle on elevated volume: Shows that sellers were actively defending that level, not just a random price test.
- Big green candle plus big volume bar: Conviction.
- Big red candle plus big volume bar: Distribution.
The strongest trade setups combine price structure, volume confirmation, and a meaningful price level all aligning at once. That kind of multi-signal confluence is what separates high-probability decisions from indicator-only guesses.
Build a High-Volume Stock Watchlist That Actually Works (3 to 7 Names)
A high volume stock watchlist is a curated, rules-based shortlist that reflects genuine opportunity. Every name on your list must earn its spot.
Watchlist Rules: Momentum, Volume, Volatility, and a Clear Why
Every stock on your watchlist must meet four criteria:
- Momentum: The stock is already moving in a clear direction with follow-through.
- Volume: Relative volume is 3 to 5 times its normal levels.
- Volatility: Controlled, directional price movement that respects key levels.
- A clear reason: You can state in one sentence exactly why it's on your list.
That last point is the one most beginners skip, and it's the one that matters most. "Earnings gap with clean daily breakout and room to run" or "sector leader holding premarket highs with 4x relative volume" are the kinds of statements that prevent hesitation when a setup triggers.
Stocks with erratic volume patterns or no identifiable catalyst introduce uncertainty that undermines execution quality.
Ranking Your List: Tier 1 (A+), Tier 2, and Observe Only
Once you've identified your 3 to 7 candidates, rank them:
- Tier 1 (A+ setups): Strongest confluence of volume, structure, catalyst, and clean risk-to-reward. These are the stocks you want to be fully prepared to trade when the bell rings.
- Tier 2: Secondary ideas you'll engage with only if your Tier 1 setups fail to trigger or don't follow through as expected.
- Observe only: Stocks that show promise but lack one element, whether that's a messy daily chart, thin premarket liquidity, or an unclear catalyst. Watching how these names behave intraday builds pattern recognition without putting capital at risk.
Most traders lose money not because they can't find opportunities, but because they jump between mediocre setups when their best ideas don't immediately move. Staying locked on Tier 1 names and having the discipline to wait is where execution quality actually improves.
Set Key Levels and Alerts (Support/Resistance, Premarket High/Low)
For every name on your watchlist, mark these levels before the market opens:
- Premarket high and low
- Prior day high
- Obvious support and resistance zones on the daily chart
Then set price alerts for when each stock approaches a key level. When a stock breaks above its premarket high with volume, that's a potential long trigger. When it fails to hold a key support level, that failure can signal a short setup.
The premarket high and low deserve special attention because they represent the range where informed participants have already been active. A clean break above the premarket high with confirming volume often signals continuation. A rejection at that level, or a loss of premarket low support, frequently leads to a reversal.
Mapping these levels before 9:30 AM means you're reacting to a plan, not improvising under pressure.
Refine Your Watchlist Daily Without Overtrading
A watchlist is a living document. Each morning, 30 to 90 minutes before the open, review every name against your criteria:
- Is the momentum still intact?
- Is volume still elevated?
- Is the catalyst still relevant?
If a stock has already made its move or the setup has deteriorated overnight, remove it without hesitation. Keeping stale names on your list out of attachment is one of the fastest ways to generate bad trades.
The daily maintenance habit also protects you from overtrading. When your list stays small and selective, FOMO has less room to operate. You're watching 5 quality names and waiting for your defined conditions to trigger, not watching 20 stocks and feeling pressure to be in something at all times.
Some mornings, the right watchlist has fewer than three names. When volume is weak market-wide, structure is messy, or no strong catalysts have emerged, the disciplined response is a shorter list and less trading. Flat days protect profitable weeks.
Risk Management for High-Volume Stocks (So You Don't Blow Up)
High volume creates opportunity, but it doesn't eliminate risk. The speed and volatility that make high volume stocks attractive are the same forces that can wipe out an undisciplined trader in minutes. The difference between traders who survive long enough to get good and those who blow up their accounts almost always comes down to how they manage risk on every single trade.
Position Sizing: How Much to Risk Per Trade (Simple Framework)
The simplest and most scalable approach is the fixed-percentage method: risk a set percentage of your total account on any single trade, typically 1 to 2%.
- $10,000 account at 1% risk = $100 maximum loss per trade
- $20,000 account at 1% risk = $200 maximum loss per trade
This approach keeps losses manageable during losing streaks while allowing your risk to scale naturally as your account grows. You're not deciding on the fly how many shares to buy based on how excited you are about a setup. You calculate your position size based on where your stop is and how much dollar risk you're willing to accept. That math-first approach is what separates traders who last from those who don't.
Stops and Exits: Defining Invalidation at Key Levels
Arbitrary stops, "I'll stop out if it drops 50 cents," are one of the fastest ways to lose money consistently. Your stop should be placed at a level where the trade is structurally wrong, not just temporarily uncomfortable.
Key levels that work well as natural invalidation points:
- VWAP
- Premarket highs and lows
- Major support or resistance zones
For example, if you're long a stock that broke above its premarket high, your stop belongs just below that level. If price reclaims that zone, the thesis is broken, not just paused. Identifying these levels before you enter is non-negotiable. If you can't define your invalidation point, you don't have a trade. You have a gamble.
Diversification vs Focus: What Beginners Should Do First
New traders often assume that watching more stocks means more opportunity. The opposite is almost always true.
Tracking too many stocks leads to overtrading, split attention, and FOMO-driven entries on setups you haven't properly analyzed. Most professional momentum traders focus on just 3 to 7 stocks per session, and beginners should aim for even fewer until their execution is consistent.
The goal early on is depth of understanding on a small, focused list. When you know a stock's key levels, its premarket behavior, and its catalyst before the bell rings, you're trading with an edge. When you're jumping between 20 tickers at the open, you're just reacting, and reacting late.
When NOT to Trade High-Volume Movers (Thin Names, Whipsaws, Hype)
High volume on a scanner doesn't automatically mean a stock is tradeable. Watch out for:
- Erratic volume spikes on thin, low-float names: These create violent price swings with wide bid-ask spreads, making it nearly impossible to get clean fills or exit at your intended price.
- Social media hype: If a ticker is blowing up on forums or financial Twitter at 9:31 AM, the move is almost certainly already extended and crowded. You're entering when smart money is already looking to exit.
- Messy conditions: Choppy market, no clear catalyst, erratic premarket behavior. When conditions are unclear, the right trade is often no trade at all.
The cleaner approach is to identify your stocks before the open, define your levels, and wait for price to come to you rather than chasing it up.
Beginner FAQs: High Volume Stocks, Scanners, and Timing
What Relative Volume (RVOL) Should Beginners Look For?
For most beginners, an RVOL of 2x to 5x is the sweet spot for identifying notable interest in a stock. At that range, you're seeing meaningful participation above the norm without chasing something that's already overextended.
When RVOL climbs above 5x or into double digits, you're often looking at exceptional momentum driven by a strong catalyst like earnings or major news. That can produce bigger moves but also sharper reversals.
One detail beginners often miss: always compare RVOL relative to that specific time of day. A stock showing 3x volume at 8:30 AM premarket carries very different weight than the same reading at 2:00 PM when overall market activity naturally slows. Context matters as much as the number itself.
How Many Stocks Should I Watch Each Morning?
Most professional traders keep their morning watchlist to 3 to 7 names, and there's a good reason for that discipline. Tracking fewer stocks sharpens your focus, improves your reaction time, and dramatically reduces the emotional noise that leads to impulsive trades.
When your list is manageable, you can actually study each name, its levels, its catalyst, its behavior, rather than scrambling between dozens of tickers at the open. Beginners especially benefit from this constraint. Starting with 3 to 5 well-researched names beats watching 20 stocks you barely understand.
Do I Need Paid Scanners to Find High-Volume Stocks?
No. Free tools can absolutely get the job done. Platforms like Finviz, Webull's desktop scanner, and Yahoo Finance all offer solid filtering capabilities at no cost. Thinkorswim also provides a built-in scanner that reliably surfaces high volume gappers each morning.
Your process matters far more than your tools. A trader with a disciplined, repeatable premarket routine using free scanners will consistently outperform someone with expensive software and no clear framework. Focus on defining your criteria well, volume thresholds, price movement, catalyst presence, and the tool becomes secondary.
What Time Should I Build My Watchlist?
Aim to build your watchlist 30 to 90 minutes before the market opens. That window gives you enough time to review daily charts, mark key support and resistance levels, and define your trade scenarios calmly, before the noise and speed of the open cloud your judgment.
Traders who scramble to build their list at 9:28 AM are reactive by default, which is exactly the mindset that leads to chasing extended moves.
Use that premarket window intentionally: identify your top candidates, write down the specific conditions under which you'd trade each one, and mark your levels. When the bell rings, you're executing a plan, not making decisions under pressure.