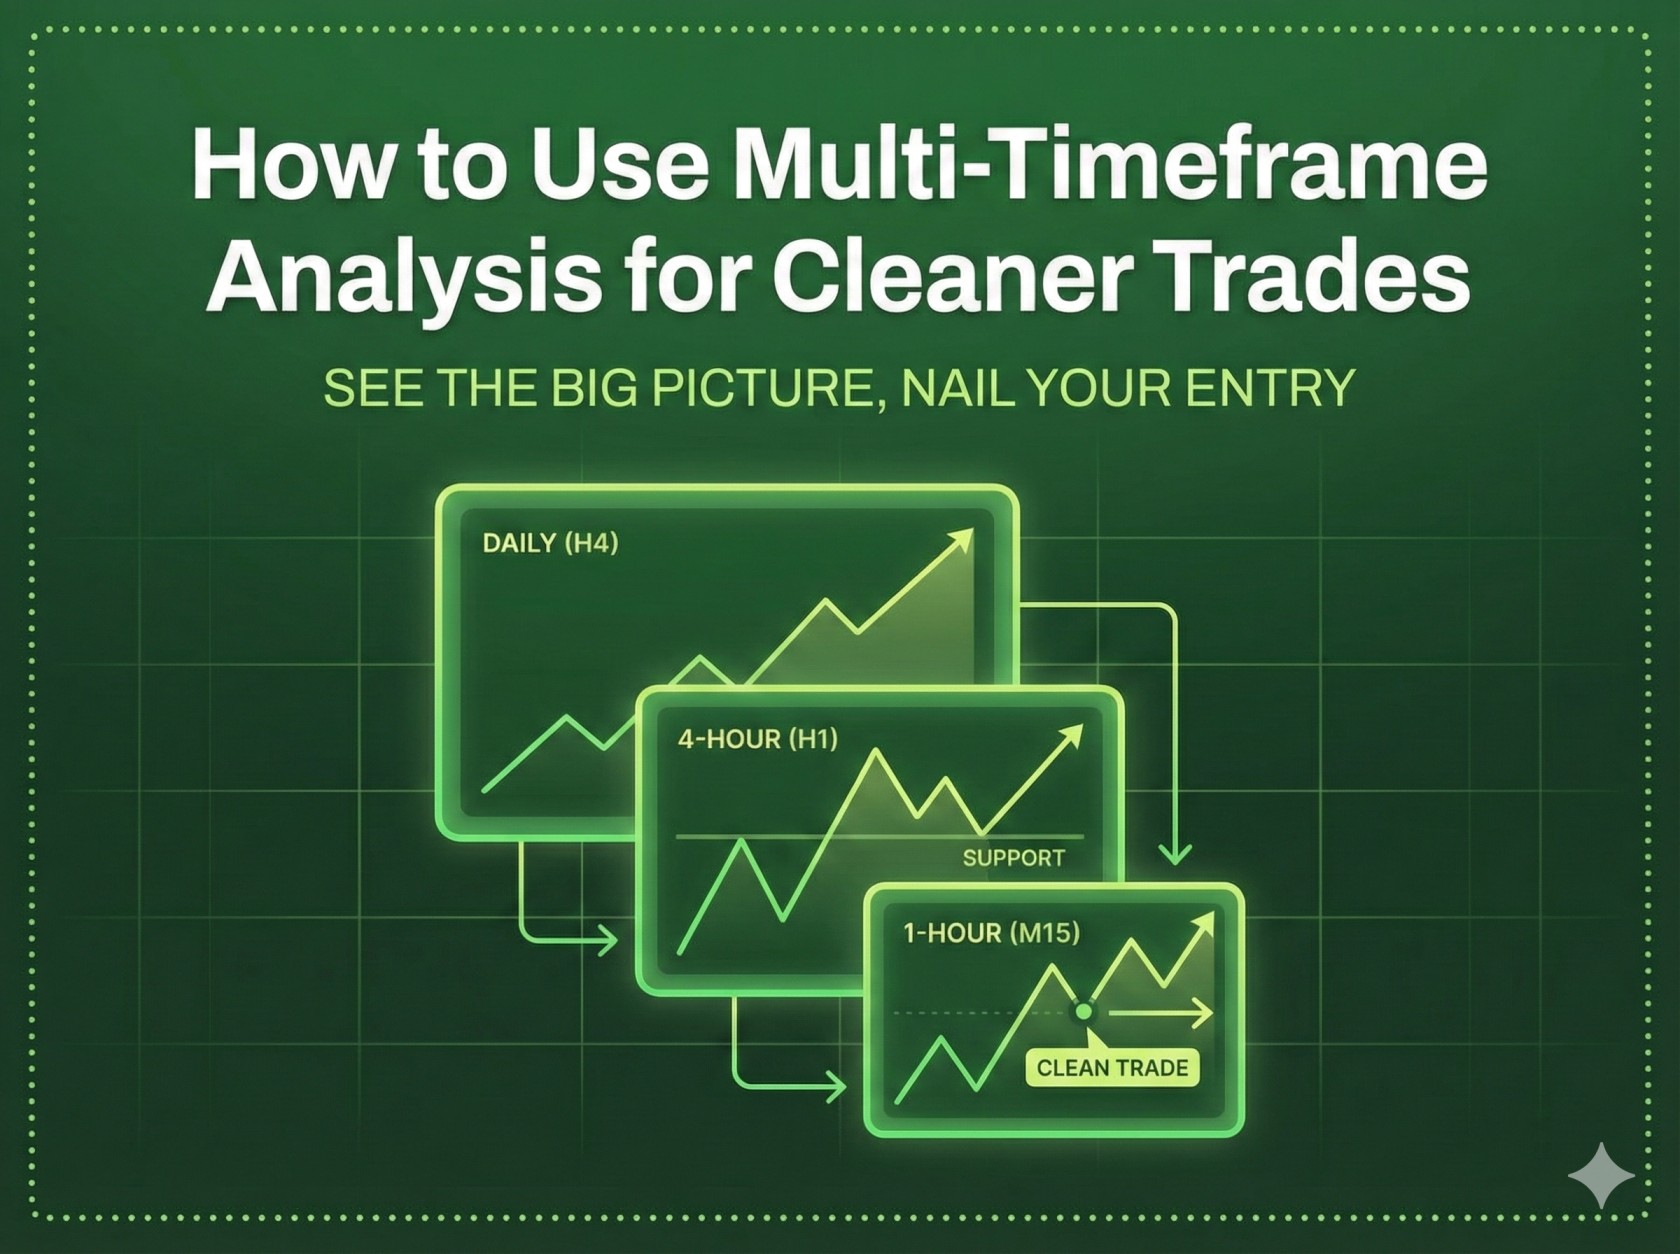
How to Use Multi-Timeframe Analysis for Cleaner Trades
.webp)
Most trading mistakes don’t come from bad entries. They come from lack of context.
Traders often focus too narrowly on a single chart and miss what the broader market structure is doing. A setup that looks perfect on a 5-minute chart can fail instantly if it’s trading directly into higher-timeframe resistance. That’s not bad luck—it’s incomplete analysis.
Professional traders avoid this by using multi-timeframe analysis.
Multi-timeframe analysis is the practice of reading price across more than one timeframe to understand:
- The overall market direction
- Where key levels truly matter
- Whether a setup aligns with larger structure or fights it
When done correctly, multi-timeframe analysis doesn’t make trading more complicated—it makes it cleaner. It helps traders filter out low-quality setups, improve timing, and trade with greater confidence.
This article explains how professional traders use multi-timeframe analysis in a practical, repeatable way—without overloading charts or creating analysis paralysis.
You won’t learn to predict markets. You’ll learn to see the full picture before committing capital.
TL;DR — Multi-Timeframe Analysis, Simplified
Multi-timeframe analysis helps traders trade with context instead of isolation.
Here’s what every trader should understand:
1. Higher Timeframes Provide Direction
Larger timeframes define the trend, structure, and key levels that smaller timeframes must respect.
2. Lower Timeframes Provide Execution
Entries, stops, and trade management are refined on lower timeframes once higher-timeframe context is clear.
3. Alignment Improves Probability
Trades that align across timeframes tend to behave more cleanly and require less emotional management.
4. Conflict Increases Risk
When timeframes disagree, volatility and failure rates increase. Professionals reduce size or stay out.
5. Fewer Timeframes Are Better
Most professionals use two or three timeframes—enough for context without confusion.
6. Multi-Timeframe Analysis Filters Bad Trades
It helps traders avoid setups that look good locally but fail due to higher-timeframe structure.
7. Cleaner Trades Come From Better Context, Not More Indicators
Multi-timeframe analysis improves clarity by showing where price is going and where it shouldn’t.
Why Single-Timeframe Trading Causes So Many Losses
Single-timeframe trading feels simple—but that simplicity is deceptive.
When traders analyze only one chart, they’re seeing a fraction of the market’s story. Important information is hidden just outside their view, and that missing context is often the reason trades fail suddenly and unexpectedly.
Professional traders don’t avoid single-timeframe trading because it’s wrong—they avoid it because it’s incomplete.
The Illusion of a “Perfect Setup”
On a single timeframe, many trades look flawless:
- Clean breakout
- Strong candle
- Nice volume spike
- Clear entry signal
Then price immediately reverses.
What happened?
In most cases, that “perfect” setup was running directly into higher-timeframe resistance, trend exhaustion, or a major level that wasn’t visible on the lower chart.
Single-timeframe traders mistake local strength for global opportunity.
Lower Timeframes Lie Without Context
Lower timeframes exaggerate movement.
Small fluctuations look dramatic. Minor pullbacks feel like reversals. Noise appears meaningful.
Without higher-timeframe guidance:
- Breakouts fail more often
- Stops get hit unnecessarily
- Trades feel random and stressful
Professionals use higher timeframes to separate real structure from noise.
Why New Traders Overtrade on One Timeframe
Single-timeframe trading encourages overtrading because:
- Setups appear more frequently
- Every move looks actionable
- There’s no filter for quality
More signals ≠ better results.
Without higher-timeframe context, traders take trades they shouldn’t—and skip patience they should have.
The Hidden Problem: Fighting the Bigger Trend
Many losing trades are actually good entries in the wrong direction.
A long setup on a 5-minute chart may be:
- A pullback short on the 1-hour chart
- A rejection at daily resistance
- A countertrend move with limited upside
Single-timeframe traders don’t see the conflict until it’s too late.
Professionals rarely fight higher-timeframe pressure.
Why Stops Feel “Unlucky”
Single-timeframe traders often say:
“My stop got hunted.”
In reality, their stop was placed in a highly visible area that made sense only on one timeframe.
Higher-timeframe structure frequently explains:
- Why price paused
- Why it reversed
- Why the trade had no room to work
Multi-timeframe analysis turns “bad luck” into understandable behavior.
Single-Timeframe Trading Increases Emotional Pressure
When traders don’t know the bigger picture:
- Every candle feels important
- Every pullback causes stress
- Every trade requires constant monitoring
This leads to:
- Early exits
- Revenge trading
- Second-guessing plans
Context reduces emotion. Emotion drops when uncertainty drops.
Professionals Don’t Trade More—They Filter Better
The biggest benefit of multi-timeframe analysis is not more entries.
It’s fewer bad ones.
Professional traders use higher timeframes to:
- Eliminate trades before they happen
- Reduce decision fatigue
- Increase confidence in valid setups
Single-timeframe trading removes those filters.
The Core Issue
Single-timeframe trading isn’t wrong—it’s unfinished.
It answers:
“What is price doing right now?”
But it ignores:
“Where is price within the bigger structure?”
That missing answer is where most losses originate.
The Three-Timeframe Framework Professionals Actually Use
Multi-timeframe analysis doesn’t mean watching five or six charts at once. That leads to confusion and hesitation.
Professional traders keep it simple. Most rely on a three-timeframe framework—each timeframe with a clear, specific job.
1. The Higher Timeframe: Direction & Structure
The higher timeframe answers one primary question:
What is the market trying to do?
This timeframe defines:
- Overall trend
- Major support and resistance
- Key decision zones
- Market context
Examples:
- Daily chart for swing traders
- 1-hour or 4-hour chart for day traders
Professionals use the higher timeframe to:
- Determine bullish, bearish, or neutral bias
- Identify areas where trades should be avoided
- Avoid fighting major structure
If the higher timeframe is unclear or choppy, professionals reduce activity or stand aside.
2. The Middle Timeframe: Setup & Alignment
The middle timeframe bridges context and execution.
It answers: Is there a tradable opportunity forming within the bigger picture?
This timeframe is used to:
- Identify momentum patterns
- Spot consolidations and pullbacks
- See how price behaves near higher-timeframe levels
Examples:
- 15-minute chart
- 30-minute chart
This is where trade ideas are formed—but not executed yet.
If the middle timeframe setup aligns with the higher timeframe bias, probability improves significantly.
3. The Lower Timeframe: Entry & Risk Control
The lower timeframe is for precision, not analysis overload.
It answers: Where exactly do I enter, and where am I wrong?
Professionals use the lower timeframe to:
- Fine-tune entries
- Place tighter, logical stops
- Manage trades efficiently
Examples:
- 1-minute or 5-minute chart
Importantly, the lower timeframe never overrides the higher ones. It executes ideas already validated by context.
Why This Framework Works
Each timeframe has a role:
- Higher timeframe = where to trade
- Middle timeframe = what to trade
- Lower timeframe = how to trade
When traders mix these roles, confusion follows.
Professionals keep them separate—and aligned.
What Happens When Timeframes Align
Alignment looks like this:
- Higher timeframe trending
- Middle timeframe consolidating or pulling back
- Lower timeframe providing clean entry signals
These trades:
- Move more smoothly
- Require less emotional management
- Have clearer invalidation levels
Alignment doesn’t guarantee success—but it improves consistency.
What Professionals Do When Timeframes Conflict
When timeframes disagree, professionals:
- Reduce position size
- Take quicker profits
- Skip the trade entirely
Conflict increases uncertainty. Skipping trades is part of professional discipline.
Keep It Simple
More timeframes don’t mean better analysis.
Two or three well-chosen timeframes, used consistently, beat a cluttered screen every time.
How to Apply Multi-Timeframe Analysis Step by Step
Multi-timeframe analysis only works when it’s applied in the same order every time. Professionals don’t jump between charts randomly—they follow a repeatable sequence that keeps decisions objective and controlled.
Here’s how that process looks in practice.
Step 1: Start With the Higher Timeframe (Big Picture First)
Always begin with the higher timeframe.
Your goal here is not to find trades—it’s to understand context.
Ask:
- Is the market trending or ranging?
- Where are the major support and resistance levels?
- Is price near an area of expansion or exhaustion?
At this stage, you should walk away with:
- A directional bias (bullish, bearish, neutral)
- Clear zones where trading makes sense—or doesn’t
If the higher timeframe is unclear or choppy, that’s valuable information. Professionals often reduce trading or stay patient during these conditions.
Step 2: Move to the Middle Timeframe (Setup Formation)
Once context is defined, drop to the middle timeframe.
Here, you’re looking for structure that aligns with the higher timeframe, such as:
- Pullbacks in a trend
- Consolidations near key levels
- Momentum patterns forming with purpose
This timeframe answers:
“Is the market offering a trade within the bigger picture?”
If no setup is forming, professionals wait. No setup means no trade—regardless of how active the market looks.
Step 3: Use the Lower Timeframe for Precision
Only after alignment exists do professionals drop to the lower timeframe.
This is where execution happens.
The lower timeframe is used to:
- Refine entries
- Identify logical stop locations
- Manage risk tightly
Importantly, the trade idea should already be valid before reaching this chart. The lower timeframe is not for creating ideas—it’s for executing them cleanly.
Step 4: Define Risk Before Entry
Before clicking buy or sell, professionals know:
- Exactly where the trade is invalidated
- How much capital is at risk
- Whether the risk is justified by the setup
If risk feels unclear or forced on the lower timeframe, that’s often a sign the higher-timeframe context wasn’t strong enough.
Step 5: Manage the Trade With Context in Mind
Once in a trade, professionals continue to respect multi-timeframe structure.
They monitor:
- Whether price holds higher-timeframe levels
- Whether middle-timeframe momentum continues
- Whether lower-timeframe behavior supports the thesis
If price violates higher-timeframe structure, they exit—regardless of what the lower chart shows.
Step 6: Review Across Timeframes
After the trade, professionals review:
- Was the higher-timeframe bias correct?
- Did the middle timeframe offer a clean setup?
- Was the lower-timeframe entry precise or rushed?
Reviewing across timeframes reveals mistakes far more clearly than reviewing a single chart.
Why This Order Matters
Most mistakes happen when traders reverse the process:
- Starting on the lower timeframe
- Finding an entry first
- Justifying it later with higher-timeframe logic
Professionals do the opposite:
Context → Setup → Entry
That sequence keeps emotion out of decision-making.
The Core Principle
Multi-timeframe analysis isn’t about predicting markets.
It’s about making sure your trade idea:
- Makes sense in the big picture
- Is supported by structure
- Is executed with precision
Cleaner trades come from clear context, not faster clicks.
Common Multi-Timeframe Mistakes (And How Professionals Avoid Them)
Multi-timeframe analysis is powerful—but only when used correctly. Most traders understand the concept, yet still misuse it in ways that increase confusion instead of clarity.
Professional traders don’t just know what to do. They know what to avoid.
Mistake 1: Using Too Many Timeframes
One of the fastest ways to sabotage multi-timeframe analysis is overloading charts.
Common symptoms:
- Daily, 4H, 1H, 30m, 15m, 5m all open
- Conflicting signals everywhere
- Hesitation and second-guessing
- Missed trades due to indecision
More timeframes don’t equal more clarity. They usually create noise.
How professionals avoid it: They stick to two or three fixed timeframes, always the same ones, each with a defined purpose.
Mistake 2: Letting the Lower Timeframe Override the Higher One
This is one of the most costly mistakes.
Traders see:
- A clean entry on the 1-minute chart
…and ignore that price is: - At daily resistance
- Extended on the hourly
- Countertrend on the higher timeframe
Lower timeframes are seductive—they move fast and feel actionable.
How professionals avoid it: They treat the lower timeframe as an execution tool only. If the higher timeframe says “no,” the trade is skipped—no matter how good the entry looks.
Mistake 3: Starting Analysis From the Wrong Timeframe
Many traders begin their day on the lower timeframe and work upward.
This causes:
- Bias toward taking trades
- Justifying bad ideas after the fact
- Emotional attachment to entries
Once you fall in love with an entry, objectivity disappears.
How professionals avoid it: They always start top-down:
- Higher timeframe (context)
- Middle timeframe (setup)
- Lower timeframe (entry)
Never the reverse.
Mistake 4: Expecting Perfect Alignment Every Time
Some traders wait for everything to align perfectly across timeframes.
Result:
- Very few trades
- Missed opportunities
- Frustration and hesitation
Markets are not static. Alignment is rarely perfect.
How professionals avoid it: They look for dominant alignment, not perfection. If higher and middle timeframes agree, minor lower-timeframe noise is acceptable.
Mistake 5: Ignoring Timeframe Conflict Signals
When timeframes disagree, traders often force trades anyway.
Examples:
- Lower timeframe breakout into higher-timeframe resistance
- Long setup on a pullback while higher timeframe is breaking down
- Strong entry but no room to target
Timeframe conflict increases failure rate.
How professionals avoid it: They treat conflict as a warning, not a challenge.
Options are:
- Reduce size
- Take quicker profits
- Skip the trade entirely
Skipping trades is a skill.
Mistake 6: Turning Multi-Timeframe Analysis Into Prediction
Multi-timeframe analysis is not about forecasting.
Traders misuse it when they say:
- “The daily says it should go up”
- “This has to bounce here”
- “Lower timeframe is wrong, higher timeframe will win”
That’s prediction, not analysis.
How professionals avoid it: They let price confirm across timeframes. If price invalidates the idea, they exit—without debate.
Mistake 7: Not Reviewing Trades Across Timeframes
Many traders review trades only on the entry chart.
This hides the real mistake.
Often the issue wasn’t:
- Entry timing, but:
- Poor higher-timeframe context
- Trading into major levels
- Ignoring structure
How professionals avoid it: They review trades on all used timeframes to identify where alignment failed.
The Key Lesson
Multi-timeframe analysis is meant to simplify decisions, not complicate them.
When used correctly, it:
- Filters bad trades
- Reduces emotional pressure
- Improves clarity
- Creates cleaner execution
When misused, it becomes just another source of confusion.
Professionals keep it:
- Minimal
- Consistent
- Purpose-driven
Final Thoughts: Cleaner Trades Come From Clear Context
Multi-timeframe analysis doesn’t give you more trades. It gives you better ones.
Most trading frustration comes from acting on incomplete information. When you see only one timeframe, you’re reacting to noise instead of understanding structure. Multi-timeframe analysis fixes that by putting every trade into context—where price has been, where it is, and where it’s likely to struggle.
Professional traders don’t use multi-timeframe analysis to predict the market. They use it to:
- Avoid trading into major levels
- Align entries with larger structure
- Reduce emotional decision-making
- Define risk more clearly
- Stay selective instead of reactive
If your goal is cleaner execution, fewer mistakes, and more confidence in your decisions, multi-timeframe analysis isn’t optional—it’s foundational.
Start simple:
- Use two or three timeframes only
- Assign each timeframe a clear role
- Always analyze top-down
- Let alignment—not urgency—drive action
Cleaner trades don’t come from faster entries or more indicators. They come from seeing the full picture before you commit capital.
Frequently Asked Questions (FAQ)
Do I need to use multiple timeframes on every trade?
Yes—if you want consistency. Even a quick check of a higher timeframe can prevent low-quality trades that look good only on a single chart.
How many timeframes should I use?
Two or three is ideal. More than that often creates confusion and hesitation instead of clarity.
Which timeframe should I start with?
Always start with the higher timeframe to establish context, then move down to refine the setup and entry.
Can multi-timeframe analysis be used for day trading?
Absolutely. Most professional day traders use higher timeframes for direction and lower timeframes for precise execution.
What if timeframes don’t agree?
When timeframes conflict, risk increases. Professional traders reduce position size, take quicker profits, or skip the trade entirely.
Does multi-timeframe analysis guarantee better results?
No strategy guarantees results. Multi-timeframe analysis improves decision-making and trade quality, which increases consistency over time.
Is multi-timeframe analysis too complex for beginners?
No. When done correctly, it actually simplifies trading by removing bad trades before they happen.
What’s the biggest mistake traders make with multi-timeframe analysis?
Letting the lower timeframe override the higher one. Entries should never contradict higher-timeframe structure.