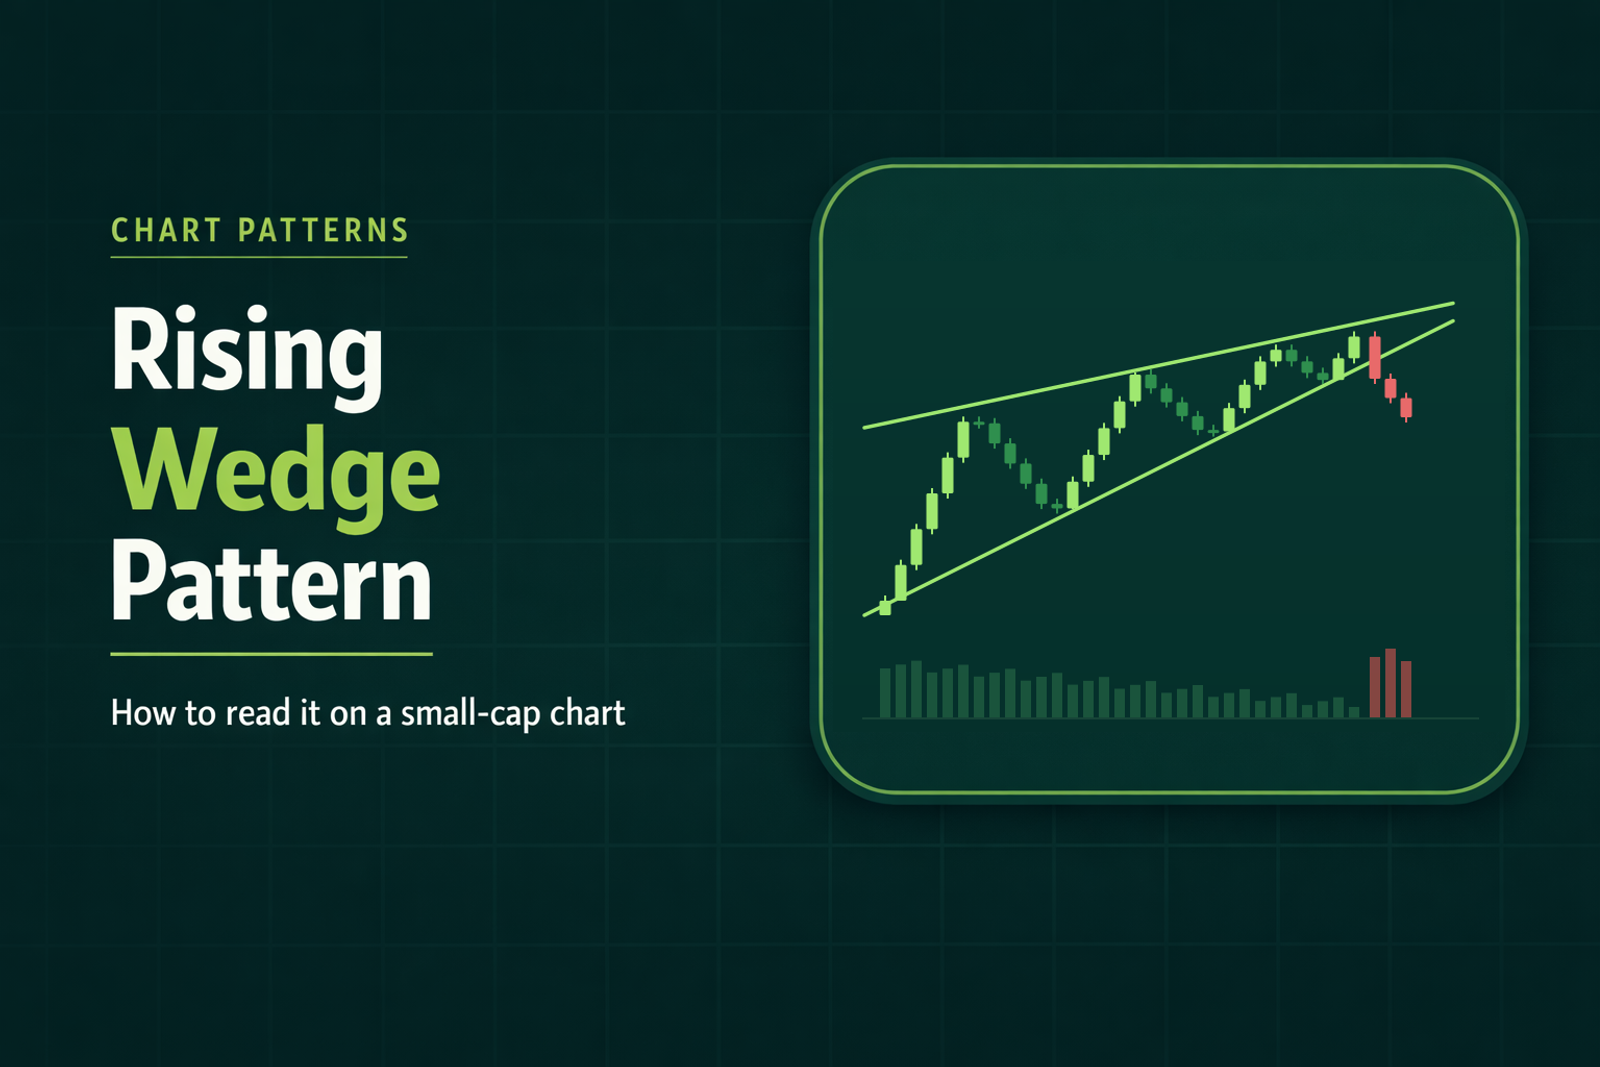
Short answer: A rising wedge (also called an ascending wedge) is a chart shape where price makes higher highs and higher lows inside two upward-sloping lines that converge. Its bias is bearish, confirmed only by a close below the lower line. For a long-only trader, it warns on a position already held and argues against starting a new long inside it.
Rising wedge identification checklist
What is a rising wedge (ascending wedge) pattern?
A rising wedge forms when a stock keeps making higher highs and higher lows, but each push up gets less done. StockCharts' ChartSchool describes "a bearish pattern that begins wide at the bottom and contracts as prices move higher and the trading range narrows."
The lower line rises faster than the upper line. ChartSchool describes "an upper resistance line that fails to keep pace with the slope of the lower support line," which it reads as "a supply overhang as prices increase."
"Ascending wedge" is the same pattern under another name, the way the falling wedge is also called a descending wedge.
The prior trend decides the label. After an advance it is a reversal pattern, and as a bounce in a downtrend it is a continuation pattern. ChartSchool's verdict covers both: "Regardless of the type (reversal or continuation), rising wedges are bearish."
ChartSchool concedes that "the series of higher highs and higher lows keeps the trend inherently bullish," so the bearish read stays a bias until something breaks.
How is a rising wedge different from similar patterns?
Here are the look-alikes in ChartSchool's terms. The falling wedge is the mirror image, covered in our falling wedge pattern guide, and our bull flag pattern guide covers the flag that slopes down after a run.
How do you draw a rising wedge without forcing it?
The common mistake is deciding a stock is about to roll over, then drawing lines until the chart agrees. Start with ChartSchool's checklist:
- Upper line. "It takes at least two reaction highs to form the upper resistance line, ideally three. Each reaction high should be higher than the previous high."
- Lower line. "At least two reaction lows are required to form the lower support line. Each reaction low should be higher than the previous low."
- Convergence. "The upper resistance line and lower support line converge as the pattern matures."
Then two rules of thumb:
- Check more than one timeframe. Our guide to the best timeframes for momentum day trading says: "A clean uptrend on the 5-minute chart may look like total chop on the 1-minute."
- Remember the textbook version is slow. ChartSchool says "The rising wedge usually forms over a three to six month period." Thomas N. Bulkowski, whose daily-chart statistics come up below, sets "3 weeks" as "the minimum duration, otherwise it's a pennant," and wants at least five touches in all: "3 touches of one trendline and 2 of the opposite." A single morning can't span three weeks, so an intraday wedge borrows the shape without that history.
What do the statistics say about rising wedges?
The most detailed numbers come from Thomas N. Bulkowski, who publishes chart-pattern statistics on ThePatternSite. The results table on his rising wedge page is headed "Rising Wedge: Important Bull Market Results," is dated "Statistics updated 8/27/2020," and says its numbers "are based on more than 1,400 perfect trades."
They describe how the pattern behaved in his sample, and his glossary measures the average move from the day after the breakout to the ultimate high or low, the extreme before a 20% trend change, an exit no trader reliably catches. Nothing in the table is anyone's trading result or win rate.
- Break-even failure is the share of patterns that fail to rise or decline "by at least 5%." In his daily-chart, bull-market sample, 51% of downward breakouts failed to fall that far.
- Direction. For the same daily-chart, bull-market sample, his page says the breakout "Can be in any direction but is downward 60% of the time." The 40% upward share in the table is our arithmetic, 100 minus that 60%.
- Targets. ChartSchool says "There are no measuring techniques to estimate the decline." Bulkowski uses the lowest valley in the pattern as the target for downward breakouts, and his daily-chart, bull-market table shows 32% meeting their target.
The 81% mix-up. Some pages quote 81% for rising wedges, often beside 38%. Both come from the upward-breakout column of Bulkowski's daily-chart, bull-market table. The 81% is 100 minus the 19% break-even failure rate, so it is the share of upward breakouts that rose at least 5%, and the 38% is the average rise after one. Neither describes the bearish case, the more common direction.
No intraday data. We found no published statistics on rising wedges for 1-minute or 5-minute charts, or for small caps, so this page does not carry these numbers over to them.
What should a long-only trader watch on an intraday small-cap chart?
Kev (Kevin Cabana, who runs the Momentum trading room) trades long only, so this page takes the long side's view. His posts don't say what he does with a rising wedge, so nothing here describes his practice on one.
1. On a stock you hold, it is a warning
Our trend reversals guide gives the long-side response to warning signs in general (it doesn't name the rising wedge, so the link to one is ours): "For a long trader, warning signs mean tighten up, trim, or get out. Confirmation means stop looking for longs in that stock."
2. Inside the wedge, it is a reason not to start a new long
In his choppy market recap, Kev wrote: "Don't buy inside a tight range. Wait for the break, then the retest. A wedge with resistance right overhead has no room to pay you." The recap doesn't say whether that wedge's top line was rising or flat, so read it as a general rule about tight ranges. In a rising wedge, the upper line is the resistance overhead.
The recap's order of operations: "Wait for the breakout, let it pull back, and enter on the retest with defined risk." The recap does not name the rising wedge. Applied to one, that breakout would be a close above the upper line, a separate setup covered below.
3. A close below the lower line is the confirmation
ChartSchool says "Bearish confirmation of the pattern does not come until the support line is broken in a convincing fashion," and "An expansion of volume on the support line break can be taken as bearish confirmation." Bulkowski's identification table puts it plainly: "The pattern confirms as a valid one when price closes outside one of the trendlines." A wick through the line doesn't count.
The close below the lower line is where the warning becomes confirmation, and the reversal post's line for that stage applies: "Confirmation is structure: a lower low on your timeframe, and price that stays below the level it broke."
When does a rising wedge fail?
Upward breaks. In Bulkowski's daily-chart, bull-market sample (statistics updated 2020), 40% of breakouts went up. Whatever the timeframe, a close above the upper line means the bearish read has failed. That break is judged on the same three checks the falling wedge guide uses: a break of the upper line, volume expanding on that break, and price holding above the broken line.
False breaks. Price slips under the lower line, then closes back inside. That is why Bulkowski's confirmation needs a close. Our bear trap guide covers false breakdowns from the long side.
Subjective lines. Two traders can draw two different wedges on one chart. Lo, Mamaysky and Wang wrote in a 2000 NBER paper that "the presence of geometric shapes in historical price charts is often in the eyes of the beholder." Wedges were not among the patterns they tested.
Stops are not guaranteed fills either. The SEC's Investor.gov glossary warns that the fill "may differ from the stop price, especially in a fast-moving market." Kev's stop-loss guide applies it to small caps: "The thin, fast stocks I trade are exactly where slippage and gaps hit hardest, so a resting stop-loss order can fill well below your price."
None of this replaces risk rules. Kev's 1-2-3 rule, as the Momentum chatroom page states it, is to "risk no more than 1% of your account on one trade, never enter without a 2:1 reward to risk, and stop trading for the day after 3 losses."
A worked example (hypothetical)
A made-up stock with round numbers, to show the structure. Nothing in it is a forecast.
The wedge. A small cap gaps up on news and runs from $3.00 to a high of $4.50 by 9:50. On the 5-minute chart, the reaction highs come in at $4.50, $4.58 and $4.64, and the reaction lows at $4.20, $4.34 and $4.46. The lows climb faster than the highs, so the gap between them narrows from $0.30 to $0.24 to $0.18. Volume shrinks with each push. On the next bar, the upper line sits near $4.70, the lower line near $4.58, and price is at $4.64.
Check 1: a new long inside the wedge. A trader who wants to buy at $4.64 with a stop at $4.54, just under the lower line, risks $0.10 a share. The 1-2-3 rule says never enter without a 2:1 reward to risk, so the trade needs $0.20 of room, up to $4.84. The upper line is near $4.70, only about $0.06 away, roughly 0.6 to 1. The trade fails the rule before it starts.
Check 2: a long already open. Say a long from earlier in the morning is still open, with a written plan to exit on a 5-minute close below the lower line. Nothing has triggered yet, so the wedge is a reason to watch that line and decide, with the plan, whether to tighten up or trim.
The break. A 5-minute candle closes at $4.52, about $0.06 under the lower line, on the heaviest volume bar of the wedge. That is the confirmation ChartSchool and Bulkowski describe: a close outside the line, with volume expanding. The plan says exit on that close, so the position is closed.
The other ending. Same wedge, but the next candle closes at $4.74, above the upper line, on heavy volume. The wedge broke upward, and the exit rule never triggers. A new long on that break is a different setup and goes through its own checks, with the 2:1 math redone from the new entry.
Neither ending is a forecast, and either can produce a loss.
Frequently asked questions
Is a rising wedge bullish or bearish?
Bearish. StockCharts' ChartSchool says "Regardless of the type (reversal or continuation), rising wedges are bearish." The bias is only confirmed when a candle closes below the lower line. Until then the stock is still making higher highs and higher lows. For a long-only trader, a rising wedge on a stock you hold is a warning to plan around. On a stock you want to buy, it is a reason to stay out until price closes above the upper line, and then to treat that break as a new setup with its own checks.
Can a rising wedge be bullish?
Its bias is bearish, but price can break either way. In Thomas N. Bulkowski's daily-chart, bull-market sample (statistics updated 2020), about 40% of breakouts went upward, and that sample says nothing about intraday small caps. An upward break is a separate long setup with its own checks.
Can a rising wedge occur in a downtrend?
Yes. There it is a continuation pattern: the wedge slopes up against the prevailing downtrend, and ChartSchool classes it as bearish in either context.
What is the success rate of a rising wedge pattern?
There is no single number. Thomas N. Bulkowski's chart-pattern statistics (daily charts, bull market, updated 2020) give a break-even failure rate, the share of patterns that failed to move at least 5% after the breakout, of 51% for downward breakouts and 19% for upward ones. The 81% some pages quote is 100 minus that 19%, so it describes upward breakouts. None of these is a trader's win rate, and none covers intraday small caps.
What is the difference between a rising wedge and an ascending triangle?
An ascending triangle has a flat top line and a bullish bias. A rising wedge's top line still rises, more slowly than the bottom line, and its bias is bearish. Both have rising lows, so check the top line first.
Watch the open with Kev
Kev trades the open live on stream in the Momentum trading room and calls out his entry and his stop on every trade, so you can see the thought process behind each decision. Membership includes the live stream and its recordings, the Momentum Scanner, the Momentum Journal, and the nightly and pre-market watchlists. Start your 7-day free trial. Cancel anytime.
This content is for educational purposes only and is not financial advice. Trading involves significant risk and may not be suitable for all traders.