Trading Journal Template: Track Like a Professional
.webp)
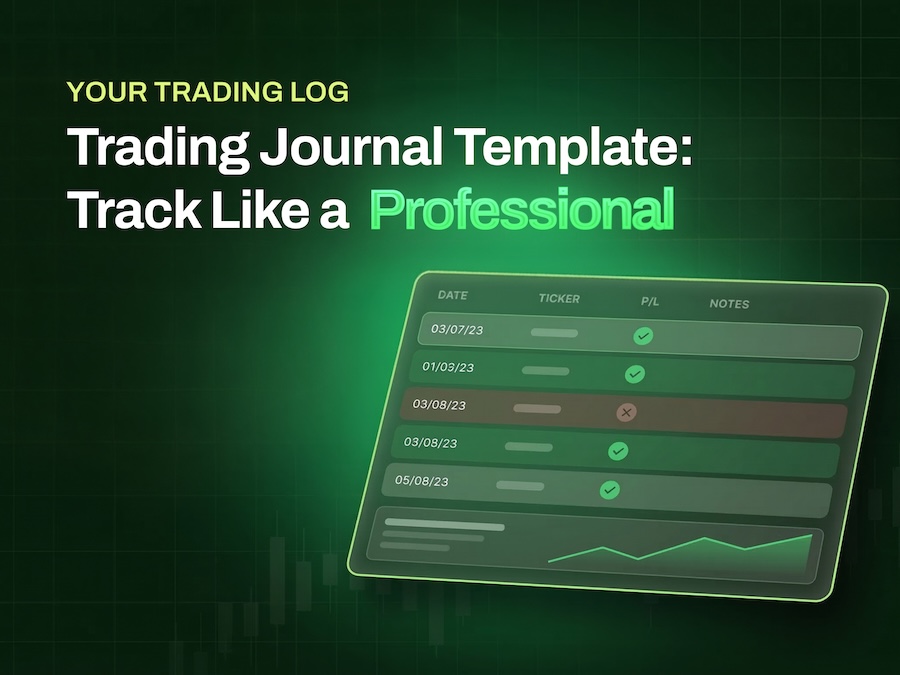
Most traders lose money not because their strategy is wrong, but because they have no honest record of what they're actually doing. Studies show that traders who journal consistently outperform those who don't by a significant margin, yet fewer than 20% of active traders maintain any structured log. This article gives you a professional-grade trading journal template, the exact metrics that matter, and a daily workflow that turns raw trade data into compounding skill.
In Brief
- A trading journal is a decision-quality database, not a trade log. The traders who improve fastest track emotional state, rule adherence, and setup context alongside price data, not just P&L.
- Win rate alone is meaningless. Expectancy, reward-to-risk ratio, and error rate together tell you whether your edge is real or whether luck is carrying you.
- The weekly review is where isolated trading days become a system. One hour of structured analysis at week's end compounds faster than any new strategy you could add.
- Tracking trades you didn't take is as important as tracking the ones you did. Restraint is a measurable skill, and your journal should reflect that.
What a Trading Journal Actually Is (and What It's Not)
A trading journal is a structured decision database. Every trade you take is an experiment, and your journal is the lab notebook. Without it, you're running experiments with no record of the conditions, variables, or outcomes, which means you can't replicate success or diagnose failure.
What separates a professional-level journal from a basic trade log is depth. Beyond entry price, exit price, and P&L, a real trading journal captures:
- Setup type
- Emotional state at entry and exit
- Rule adherence (planned vs. unplanned)
- Post-trade reflection
That combination of quantitative data and qualitative context is what transforms raw trade history into something you can actually act on.
Why P&L Alone Lies
Profit and loss numbers tell you what happened. They don't tell you why.
A trader can finish a week up 8% through lucky, impulsive entries and broken rules. Another finishes flat despite executing flawlessly in a choppy market. The P&L looks completely different. The process quality is reversed. If you only track dollars, you'll reward the wrong behaviors and never understand what's actually producing your results.
This is where most traders get stuck. They have a good month, assume their strategy is working, then blow up the following month when conditions shift, because they were never tracking whether their edge was real or whether luck was carrying them.
Metrics like win rate, reward-to-risk ratio, and expectancy reveal the mathematical truth behind your system. A 60% win rate means nothing if your average loss is three times your average win.
Your journal also exposes psychological traps that P&L conveniently hides:
- FOMO-driven entries that cluster around high-volume breakouts
- Revenge trading after losses, often with larger-than-normal size
- Impatient early exits that cut winners before they reach target
Once you can see that 70% of your losing trades happen after a prior loss, or that your worst entries cluster around the first 15 minutes of the session, you have something actionable.
Who This Template Is For
A trading journal template works across every active trading style because the core problem it solves is universal: without a structured feedback loop, you're flying blind.
- Day traders benefit most from real-time emotional tracking and session-level pattern recognition. Knowing which time of day your edge is strongest, how many trades precede your worst decisions, and what your error rate looks like on high-volatility days gives you a precision edge that no chart pattern can provide.
- Swing traders need their journal to capture multi-day decision quality, including how well they manage open positions and whether they're exiting based on their plan or their anxiety.
- Futures, forex, and crypto traders need an additional layer: market condition context. Volatility regimes, session overlaps, and macro catalysts all influence trade quality in ways that pure technical setups don't account for. Logging these conditions alongside your trades lets you identify which environments your strategy thrives in, and which ones you should sit out entirely.
Downloadable Trading Journal Template Options (Excel, Sheets, Notion, PDF)
The format you choose matters more than most traders realize. The wrong tool creates friction, and friction kills consistency. Before you download anything, match the format to how you actually work, not how you think you should work.
Which Format Should You Use?
Excel or Google Sheets is the right choice if you want speed and flexibility. You can log a trade in under 60 seconds, customize columns on the fly, and build your own formulas for metrics like win rate, average reward-to-risk, and expectancy. Google Sheets adds cloud access across devices, which is useful if you trade from multiple setups. The tradeoff: you're doing the heavy lifting manually. Calculations, charts, and reviews all require your own upkeep.
Notion works best for traders who want a database-style system that connects their trade log to weekly reviews, mistake patterns, and a setup library in one workspace. It's slower to enter individual trades but significantly more powerful for spotting behavioral trends over time. If you think in systems rather than spreadsheets, Notion's relational database structure will feel like a natural fit.
PDF is the simplest option and the most underrated. A printable journal is ideal for traders who think more clearly on paper, or who want a distraction-free log that keeps them away from screens between trades. It won't calculate anything automatically, but writing by hand tends to deepen reflection, which is the whole point.
Template Overview: Tabs, Columns, and Structure
A professional-grade trading journal template is a structured system with multiple components, each serving a distinct purpose. Here's how a complete template should be organized:
Trade Log (Core Tab)
Every trade gets its own row, capturing: date, ticker, setup type, entry price, exit price, position size, stop loss, target, result in dollars and percentage, and a brief execution note. This is your raw data layer, the foundation everything else is built on.
Pre-Trade Checklist
Forces you to answer key questions before entering a position: Does this fit my setup criteria? Is risk defined? Am I in a clear emotional state? This single addition can dramatically reduce impulsive entries and rule-breaking trades. Think of it as a mandatory pause built directly into your workflow.
Metrics Dashboard
Auto-calculates your core performance indicators: win rate, average reward-to-risk, expectancy, profit factor, and drawdown. Rather than spending 45 minutes organizing numbers, you spend 10 minutes interpreting patterns and making decisions that sharpen your edge.
Weekly Review Tab
Where isolated trading days become a cohesive system. Each week, you record your top metrics side by side, note which setups performed best, identify your most common errors, and write a short statement of intent for the week ahead.
Mistakes Library
The tab most traders skip, and the one that creates the biggest edge over time. Every rule violation, emotional exit, or impulsive entry gets logged here with a brief description of what triggered it. Over weeks and months, patterns emerge. You'll start seeing causes instead of coincidences.
How to Set It Up in 10 Minutes
Step 1: Copy the file.
Duplicate the template into your own workspace. Don't modify the original. Keep a clean master copy you can reference if you need to reset.
Step 2: Set your account size and risk defaults.
In the Metrics Dashboard tab, enter your starting account balance and your default risk percentage per trade (most traders use 1-2%). This allows your position sizing columns and drawdown calculations to populate automatically as you log trades.
Step 3: Create your dropdowns.
In the Trade Log tab, build dropdown menus for three key fields:
- Setup type (e.g., VWAP pullback, ORB breakout, trend continuation)
- Error category (e.g., early exit, chased entry, no stop set)
- Emotional state (e.g., confident, anxious, revenge-trading)
Dropdowns make logging faster and make your data filterable, so you can sort trades by setup performance or emotional state with a single click.
Step 4: Log your first trade.
Don't wait for the perfect moment. Enter a recent trade, even a paper trade, to confirm every column populates correctly and your metrics dashboard updates as expected. The habit of daily use is everything.
The Core Trade Log: Fields Every Professional Records
A trading journal template is only as powerful as the data you feed it. Most traders start journaling with good intentions, then slowly strip their logs down to ticker, entry, exit, and P&L. That bare minimum tells you almost nothing about why a trade worked or failed.
Professional traders take the opposite approach: they record everything that matters before, during, and after execution, building a database rich enough to reveal genuine patterns over time.
Trade Details (The Non-Negotiables)
Every trade log entry starts with a fixed set of fields that create an objective, searchable record of what actually happened. At minimum, your template needs:
- Date and time
- Ticker or symbol
- Direction (long or short)
- Setup name
- Timeframe
- Entry price
- Exit price
- Position size
- Stop level
- Profit target
Beyond the basics, two columns separate amateur logs from professional ones:
R-multiple expresses the result in terms of risk units rather than raw dollars, which lets you compare a $50 win on a small account to a $500 win on a larger one with perfect clarity.
Fees and slippage are the silent killers that erode edge over time. A trader taking ten trades per day at $5 per trade pays over $1,200 per month just to participate. Logging these costs forces you to see the true cost of your activity.
Finally, include a screenshot link field for every entry. Attaching a chart image at the moment of the trade, not reconstructed hours later, captures the exact market structure you were reading. When you review 200 trades three months from now, that screenshot is the difference between genuine insight and guesswork.
Strategy and Context Tags (How You Find Your Edge Window)
Raw trade data tells you what happened. Context tags tell you when your edge actually exists, and that distinction is where most traders leave serious money on the table. Research consistently shows that roughly 70% of profits come from 20% of trading time. Without tagging your trades by context, you'll never identify that high-probability window.
Build your template around four context dimensions:
- Market regime: Was the broader market trending, ranging, or in a news-driven spike? A VWAP pullback setup that prints beautifully in a trending tape may bleed you out in a choppy, low-volume environment.
- Volatility level: Log whether conditions were elevated, normal, or compressed. Your position sizing and target placement should shift accordingly, and your journal data will prove it.
- Catalyst or news: Earnings, FDA decisions, sector rotation, and macro announcements all change how price behaves around key levels. Tagging these lets you filter your setup performance by catalyst type.
- Time-of-day blocks: Paired with a simple "tradeable vs. no-trade conditions" flag. Professionals define in advance when they will not trade. Logging which sessions met your tradeable criteria and which didn't lets you calculate your true edge window over time, rather than blending high-quality setups with noise-driven entries that dilute your statistics.
Execution Notes: Entries, Exits, and Rule Adherence
The most underused column in any trading journal template is the rule adherence flag. This is where you record, with brutal honesty, whether the trade was planned or unplanned, whether it passed your pre-entry checklist, and in a single sentence, why you took it.
That one sentence is more valuable than paragraphs of post-hoc rationalization. "Took it because VWAP held and volume confirmed" is useful data. "Took it because it looked good" tells you nothing.
Separate your planned trades from unplanned ones and track them independently:
- Planned trades represent your system's true edge
- Unplanned trades are where emotional decision-making lives
When you calculate win rate, expectancy, and profit factor across both categories, the gap is almost always shocking, and it's the clearest possible argument for tightening your checklist discipline. A checklist pass/fail column, reviewed weekly, will show you whether your error rate is trending toward elite territory (under 5%) or creeping into dangerous ground (above 20%).
Execution notes should also capture the quality of your entries and exits. Did you exit early out of fear, or did you hold to your target? Did you move your stop further away out of hope? These behavioral patterns, logged consistently, create the feedback loop that turns experience into skill.
Professional Trading Metrics Dashboard (with Formulas)
Most traders measure success by checking their account balance at the end of the day. A professional trading journal template translates raw activity into actionable intelligence. The metrics below separate traders who improve systematically from those who repeat the same mistakes with more conviction.
The 4 Core Metrics That Matter Most
Win Rate
The starting point, and the most misunderstood number in trading.
Win Rate (%) = (Winning Trades / Total Trades) x 100
A trader who wins 55 out of 100 trades has a 55% win rate, but that number means nothing without context. A 70% win rate paired with a 0.5:1 reward-to-risk ratio produces a losing system. A 40% win rate with a 3:1 ratio produces a profitable one.
Reward-to-Risk Ratio
What gives win rate its meaning.
Reward-to-Risk = Average Win / Average Loss
If your average winner is $300 and your average loser is $100, your R:R is 3:1. Most professional day traders target a minimum of 2:1 on their setups. Anything below that requires an unusually high win rate to stay profitable, which is psychologically unsustainable over hundreds of trades.
Expectancy
The single number that tells you whether your system has a mathematical edge.
Expectancy = (Win Rate x Avg Win) - (Loss Rate x Avg Loss)
If your win rate is 50%, your average win is $200, and your average loss is $100, your expectancy is $50 per trade. That means over 100 trades, you can expect to generate $5,000 in profit, regardless of short-term variance. Negative expectancy, no matter how good your setups look, means you're losing money in slow motion.
Profit Factor
A quick system health check.
Profit Factor = Gross Profit / Gross Loss
A profit factor above 1.5 indicates a consistent edge. Above 2.0 signals strong discipline and system quality. Track this monthly. A declining profit factor often reveals that you've started breaking rules subconsciously, even when your win rate looks stable.
Risk and Resilience Metrics (Drawdown, Exposure, Risk of Ruin)
Drawdown
Measures exactly how much pain your system can inflict before you abandon it.
Drawdown (%) = ((Peak Equity - Trough Equity) / Peak Equity) x 100
If your account peaks at $10,000 and drops to $8,500, your drawdown is 15%. Benchmarks worth knowing:
- Under 10%: institutional-grade consistency
- 10-20%: normal for active traders
- Above 30%: typically signals overleveraging or deeply inconsistent execution
Risk of Ruin
Takes drawdown analysis further by calculating the probability that a losing streak will force you out of the market entirely. The smaller your edge and the larger your risk per trade, the higher your risk of ruin climbs. Professionals calculate an acceptable risk of ruin (under 1% is institutional standard) and work backward to determine appropriate position sizing. Your first goal isn't to double your account. It's to still be in the game after 1,000 trades.
Average Hold Time
Adds a behavioral dimension to resilience tracking.
Average Hold Time = Total Time in All Trades / Number of Trades
When your losing trades are consistently longer than your winning trades, it's a signal you're avoiding pain, holding losers in hope while cutting winners out of fear. This metric exposes hidden behavioral biases that P&L alone will never reveal.
Discipline Metrics: Error Rate, Trade Efficiency, Time-in-Market Utilization
These three metrics shift the dashboard from measuring outcomes to measuring behavior, which is where real improvement lives.
Error Rate
Your personal accountability score, and the metric most traders are afraid to calculate honestly.
Error Rate (%) = (Number of Rule-Breaking Trades / Total Trades) x 100
If you took 40 trades this month and 8 involved broken rules, your error rate is 20%. Interpretation bands:
- Under 5%: elite-level rule adherence
- 5-10%: professional consistency
- 10-20%: emotional trading is creeping into your system
- Above 20%: your system is effectively compromised
A trader with a 60% win rate and a 5% error rate will outperform a 70% win-rate trader with a 25% error rate, every single time.
Trade Efficiency
Measures how effectively you capture available market movement.
Trade Efficiency (%) = (Actual Profit / Maximum Possible Profit) x 100
If a trade moved 100 points from your entry to its peak but you only captured 60, your efficiency is 60%. Benchmarks:
- 40-60%: normal execution
- 60-75%: excellent
- Below 40%: signals mistimed entries, exits, or emotional interference
Tracking efficiency by setup type often reveals that you're highly efficient on breakouts but poor on reversals, telling you exactly where your psychological alignment breaks down.
Time-in-Market Utilization
Reframes what "active trading" actually means.
Time-in-Market Utilization = Active Trading Time / Total Market Time, weighted by profitability
Two traders can both earn 10% in a month, but if one is in trades 90% of the time and the other only 15%, the second trader's risk-adjusted performance is dramatically superior. Benchmarks:
- Under 20% exposure with strong returns: elite patience
- 20-40%: ideal for most swing traders
- Above 60%: typically indicates overtrading or a lack of selectivity
The traders who earn the most aren't always in the market. They wait for the narrow windows where their edge actually exists, then execute with precision.
The Hidden Edge: Emotion Audit and Process Scoring
Most traders obsess over their P&L at the end of the day. Green day? Good trader. Red day? Bad trader. This binary thinking keeps most people stuck in a cycle of inconsistent performance, because it completely ignores the one variable that actually determines long-term success: the quality of your process.
The traders who build lasting edge aren't necessarily the ones who win the most on any given day. They're the ones who understand why they made every decision they did.
Emotion Audit Prompts (1 Sentence Each)
The emotion audit is the section of your trading journal template that most traders skip, and the one that separates professionals from everyone else. It's training. You're reverse-engineering your mindset so it stops sabotaging your system one impulsive decision at a time.
Each day, after the market closes and you've had time to decompress, write one honest sentence in response to each of these four prompts:
- "When did I feel most confident today?" This identifies the conditions under which your decision-making is sharpest, helping you replicate that mental state.
- "When did emotion influence my decision?" This is where the real data lives, the moment you deviated from your plan because fear, greed, or frustration took the wheel.
- "What was my biggest mental win today?" Not about profit. About discipline. The trade you didn't take, the stop you honored, the FOMO you resisted.
- "What will I do differently tomorrow?" One specific, actionable adjustment, not a vague promise to "be more disciplined."
The power of this four-prompt structure is its brevity. You're not writing a novel. You're capturing raw, honest data points that compound into self-awareness over weeks and months. When you look back at 30 days of emotion audits, patterns emerge that no P&L statement could ever reveal.
Grade Your Day on Process, Not Profit
A perfectly executed losing day is more valuable than a profitable day built on broken rules. Luck hides bad process, and bad process eventually catches up with you. The Daily Performance Rating system in your trading journal template forces you to confront this truth every single session.
Score yourself on a 1-5 scale across five categories:
- Plan adherence
- Risk discipline
- Emotional control
- Trade quality
- Journaling
Each category gets its own rating, and you review them as a whole picture of how you actually performed, not how the market treated you. A trader who scores 4s across the board on a red day is building something durable. A trader who scores 2s on a green day is borrowing from future performance.
The real objective isn't to hit perfect 5s every day. The goal is to reduce variance, to perform similarly well on both your best and worst days. When your process scores are tight and predictable, your results eventually follow.
Common Psychology Traps Your Journal Will Expose
The most valuable thing a well-structured trading journal template does over time is connect your emotional patterns to specific, identifiable behaviors. These show up in your data as concrete, recurring mistakes that cost you real money.
Impatience manifests in two opposite ways: exiting winners too early because you can't tolerate uncertainty, or holding losers too long because you're hoping the trade turns around. When you review your emotion audit entries and notice repeated phrases like "exited early, fear of reversal" or "held through my stop hoping for a bounce," that's impatience. The fix isn't willpower. It's automating exits with predefined stop-loss and take-profit levels so the decision is made before emotion enters the picture.
Revenge trading is the most destructive pattern your journal will surface. It typically shows up as a cluster of trades taken in rapid succession after a loss, often with larger-than-normal size. When you score yourself a 1 on risk discipline and trace it back to your emotion audit entry, "felt angry after the morning loss and needed to make it back," you've identified the exact trigger. Loss aversion makes losses feel twice as painful as equivalent gains, which is why the emotional pull toward revenge trading is so powerful. Your journal makes this pattern visible before it becomes a habit.
FOMO entries appear in your trade quality scores as impulsive, unplanned positions taken because a stock was moving and you didn't want to miss it. These trades almost always have poor reward-to-risk ratios because you're entering extended, not at a planned level. Over time, your journal will show you that FOMO trades cluster around specific conditions: high-volume breakouts, social media buzz, or watching other traders win on a move you passed on.
Overtrading from boredom or dopamine-seeking disguises itself as hustle. Your brain rewards activity with dopamine, making excessive trading feel productive even when it's destroying your edge. When your journaling score is consistently low alongside a high trade count, that's the signal. Slow days with no clean setups are not problems to solve by taking more trades. They're opportunities to protect capital and wait.
How to Use the Template Daily: A Pro Workflow (Capture, Analyze, Adjust)
A trading journal template is only as powerful as the routine built around it. Most traders fill in a few fields after a trade, close the tab, and wonder why nothing improves. The difference between a journal that collects data and one that compounds skill comes down to how deliberately you use it, before the market opens, during the session, and in the 30 minutes after the close.
Pre-Market: Plan Your Trades Like a Contract
The pre-market window is where professional-level trading actually begins. Before a single candle prints, your job is to define exactly what you're looking for, and more importantly, what conditions would make you not trade.
Open your trading journal template and write out:
- Planned setups
- Specific entry triggers
- Target levels
- Stop placements
Treat this plan like a signed contract with yourself. Vague intentions don't count.
One of the most underused fields in any trading journal template is the "what makes me NOT trade today" prompt. Defining your no-trade conditions in advance, choppy pre-market structure, news catalysts outside your setup criteria, or a prior day's emotional blowup, removes the temptation to force trades when conditions aren't right.
Finally, assign yourself a single daily focus metric. Rather than trying to fix everything at once, pick one behavioral target: risk discipline, reward-to-risk adherence, or position sizing precision. Write it at the top of your journal entry so it stays visible throughout the session.
During Market: Checklist and In-Session Notes
Once the bell rings, your pre-market plan becomes your operating manual. Before entering any trade, run through a quick pre-entry checklist directly in your journal:
- Does this setup match what I planned?
- Is my risk defined?
- Am I entering from a place of clarity or emotion?
If any answer is "no," you don't trade. Full stop. Checklists slow impulsivity, and slowing impulsivity creates the clarity that separates reactive traders from deliberate ones.
Keep your in-session notes short and raw. You don't need full sentences. A few words capturing your emotional state in real time are far more valuable than reconstructed memories written hours later. Notes like "exited early, fear of reversal" or "hesitated on entry, second-guessed the setup" give you honest data that a clean trade log never will.
One of the most effective mid-session tactics is hiding your P&L during live trading. Checking your dollar figure after every trade triggers emotional reactivity, the urge to lock in gains too early or revenge-trade after a loss. By keeping P&L hidden until the session ends, you force yourself to evaluate each trade on process rather than outcome.
Reserve the first 10-15 minutes after the open as an observation window only. Watch price action, note whether your planned setups are forming, and let the market show its hand before you commit capital.
Post-Market: 30-Minute Review That Compounds Skill
The trading day doesn't end when the market closes. It ends when the lesson has been captured.
Before you open your journal, step away for 15-20 minutes. Walk, eat, do anything non-market related. A calm brain reviews more accurately than a reactive one, and the emotional residue from the session will distort your analysis if you don't let it settle first.
Once you're ready:
- Log every trade with the core data points: ticker, setup type, entry and exit prices, position size, result, and a brief note on your emotional state.
- Calculate your key metrics for the day: win rate, reward-to-risk ratio, and whether your error rate stayed clean. A profitable trade entered impulsively is still a red flag, because luck hides bad process.
- Pick exactly one thing to improve tomorrow. Not three. Not a complete overhaul of your system. One specific, actionable adjustment: "I will not enter before the 9:45 AM execution window" or "I will hold my winner until the planned target rather than exiting at the first sign of heat."
This single-improvement approach is what turns your trading journal template from a record-keeping tool into a genuine skill-compounding system. Each small behavioral adjustment stacks, and over weeks and months, the cumulative effect on your consistency and profitability becomes undeniable.
Weekly Review and Calibration: The 1-Hour Pro Reset
Most traders treat the end of the week like the end of a shift: close the platform, walk away, and hope next week goes better. That's exactly why most traders repeat the same mistakes with a different calendar date. A structured weekly review transforms five isolated trading days into a cohesive, improving system.
Weekly Snapshot: The 3 Numbers to Compare Side-by-Side
Your weekly review starts with three numbers placed side-by-side: Win Rate, Expectancy, and Error Rate.
These three metrics together tell a story that no single number can tell alone:
- Win Rate shows whether your setups are connecting
- Expectancy reveals whether your edge is mathematically real
- Error Rate exposes whether your biggest problem is the market or your own discipline
The skill here is interpretation, not just recording. A lower Win Rate paired with rising Expectancy is actually a sign of progress. It means you're cutting losers faster and letting winners run longer, which is exactly what professional execution looks like. Conversely, a rising Win Rate with falling Expectancy is a warning signal. You may be taking profits too early and holding a false sense of improvement. Don't let a green week fool you if the underlying numbers are deteriorating.
Setup Performance Analysis: Find Your Best Strategy
Once you've reviewed your headline metrics, break your results down by setup type. Ask:
- Which setups delivered profit this week?
- Which ones drained capital or emotional energy?
- Did losing setups fail due to poor execution or genuine underperformance?
This distinction matters enormously. A well-executed trade that loses is very different from a sloppy entry that happened to work.
The data will often surprise you. You may discover that 70% of your weekly profits came from one specific setup during a narrow window of market conditions. That's your edge window, the concentrated zone where your strategy genuinely works. Professional traders identify this window and compress their activity around it, trading less overall but extracting far more per hour of exposure.
If a setup fails three weeks in a row despite clean execution, that's not bad luck. That's data telling you to pause or pivot that strategy entirely.
Behavioral Pattern Mining: Times of Day, Triggers, Mistakes
Numbers explain what happened. Behavioral analysis explains why.
Segment your weekly results not just by setup, but by time of day and volatility conditions. You may find that your morning trades between 9:45 and 11:00 AM carry a strong positive expectancy, while your afternoon trades consistently drag performance down. That's a pattern worth acting on.
Go deeper by examining your emotional triggers. Review your in-session notes and ask:
- When did emotion influence a decision this week?
- Did you size up too aggressively after a winning streak?
- Did you abandon your stop-loss during a volatile news event?
These behavioral fingerprints repeat themselves until you name them explicitly. The traders who improve fastest aren't those who find better setups. They're the ones who identify the specific conditions that cause their discipline to slip and build rules around those moments before they happen again.
Create Next Week's Rules and Constraints
The final step transforms your analysis into action.
Write a weekly intent statement: one clear sentence that anchors your mindset for the coming week. Something like: "This week, I trade smaller in high-volatility conditions and stop after two consecutive losses." This sentence becomes your mental anchor, replacing vague intentions with a concrete behavioral commitment.
Alongside your intent statement, write one or two specific rule updates based on what the data revealed:
- If your error rate spiked during afternoon sessions: no trades after 12:00 PM
- If volatility caused you to oversize: reduce position size by 50% on any day VIX is elevated
These aren't punishments. They're precision adjustments made from evidence, not emotion. A well-designed trading journal template makes this process repeatable, giving you a structured place to document both the insight and the rule change so you can track whether the adjustment actually works the following week.
Stop Overtrading with Your Journal: Built-In Guardrails
Add Hard Trade Caps and Non-Tradeable Conditions to the Template
The most effective trading journal template doesn't just record what you did. It actively prevents you from doing too much.
Before the market opens, your template should display your predefined limits front and center:
- Maximum number of trades per day (typically 3-5 for most day traders)
- A cap per setup type
- A reduced allowance after a loss
When you hit that cap, you log it: "Daily trade limit reached at 10:47 AM," and you're done, regardless of how compelling the next setup looks.
Equally important are your non-tradeable conditions. Your template should include a standing checklist:
- No trades in the first five minutes
- No trades on low-volume days
- No trades when market structure is unclear
Logging these conditions each morning forces you to confront them consciously rather than conveniently ignore them when FOMO kicks in. Every trade you skip because conditions weren't met is a win worth recording.
Mandatory Pause Rules After Losses (Circuit Breakers)
One of the most powerful guardrails you can embed in a trading journal template is the mandatory pause rule: a non-negotiable circuit breaker that activates after a loss.
The standard professional benchmark is 10-20 minutes of complete disengagement. Step away from the screen, close the chart, and physically leave your workspace. This interrupts the loss, frustration, revenge trade cycle that destroys accounts.
What makes this work inside your journal is the accountability layer. During your pause, log a single sentence answering one question: "Was my next impulse a setup or an emotion?"
That honest self-audit, written in real time while the urge is still fresh, is far more valuable than any reconstructed memory you'd capture later. If the answer is "emotion," you've just saved yourself from a revenge trade. If it's genuinely "setup," the market will still be there in 15 minutes. Either way, the pause wins.
Track "Trades Avoided" (Professional Restraint)
Most traders only track what they did. Professional traders also track what they didn't do, and that distinction is where real discipline compounds.
Add a dedicated "Trades Avoided" log to your template with three simple fields:
- Time
- Ticker or setup you passed on
- One-line reason
Examples might read:
- "Waited for pullback instead of chasing"
- "Skipped choppy open conditions"
- "Avoided revenge trade after morning loss"
This log does something psychologically powerful: it reframes restraint as an achievement rather than a missed opportunity. Every entry in your Trades Avoided log is evidence that your system is working. Over weeks of review, you'll start to see patterns in what tempts you most, whether that's FOMO on momentum spikes or the urge to re-enter immediately after a stop-out. Celebrating restraint reinforces it, and your journal becomes the mechanism that makes selectivity feel like progress rather than passivity.