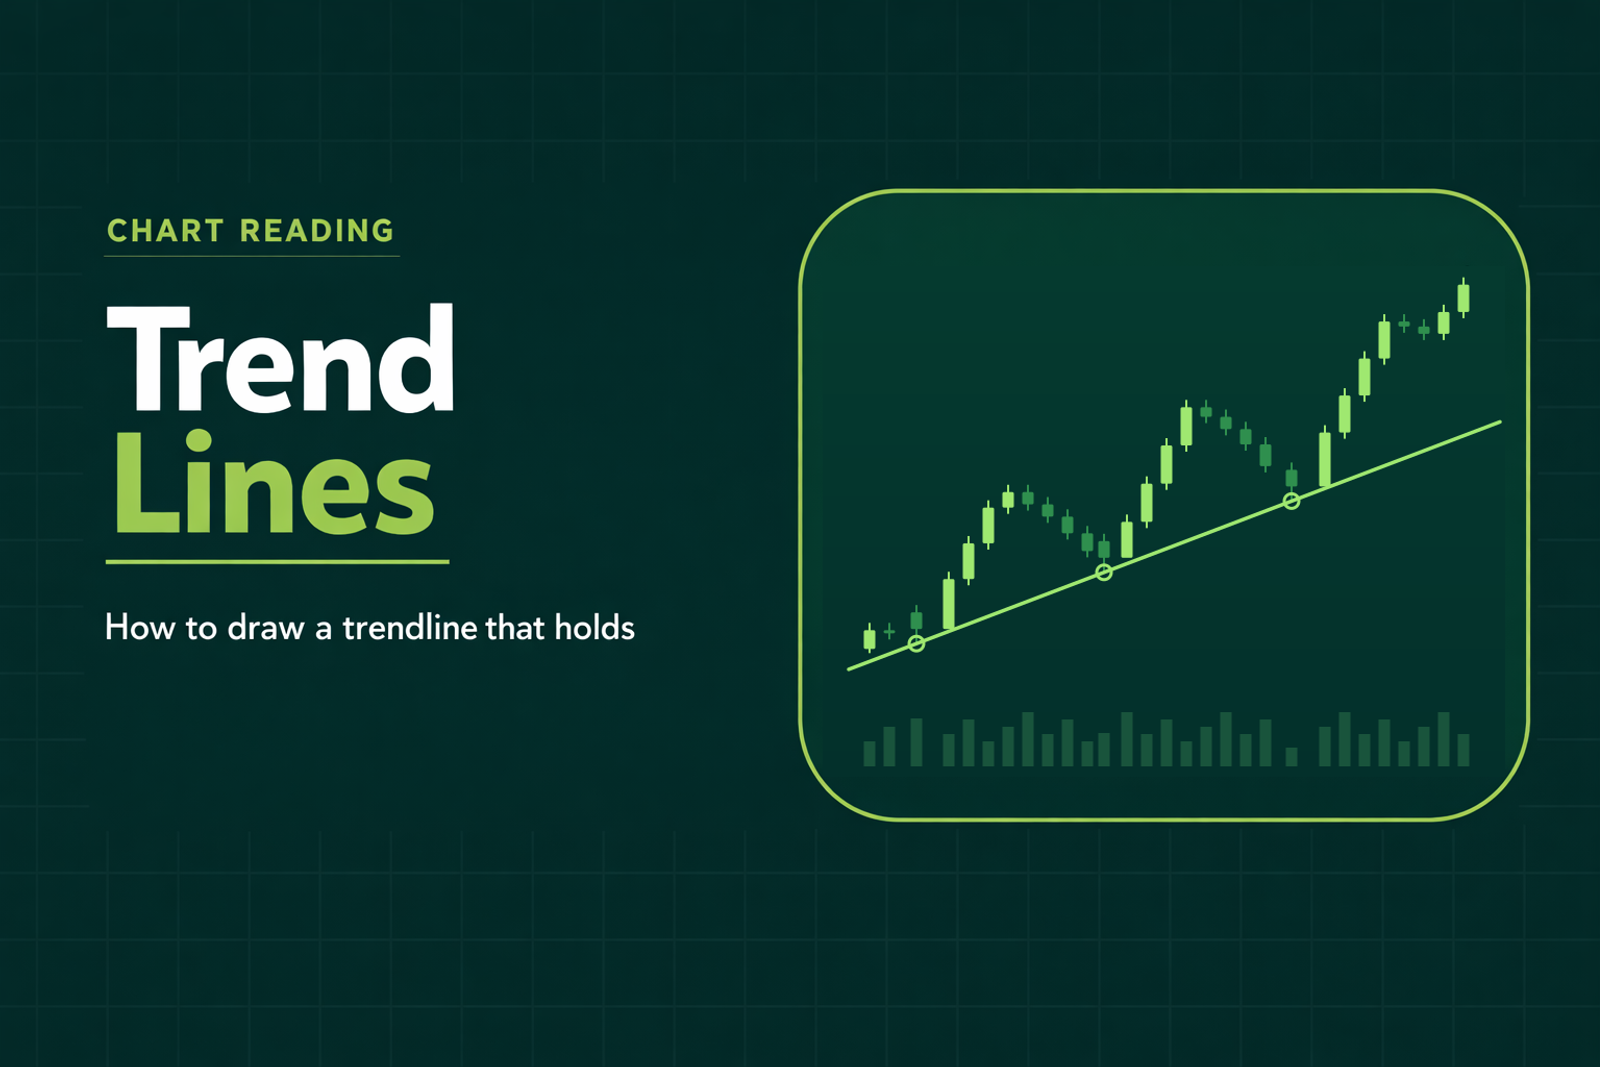
Short answer: A trendline (also written trend line) is a straight line through two or more swing lows or swing highs, the points where price turns. An uptrend line runs under rising lows and acts as support. A downtrend line runs over falling highs and acts as resistance. StockCharts' rule is that two points draw it and a third confirms it. A break of the line is a warning that the trend may be changing.
How to draw a trend line on a 5-minute chart
Valid vs forced trend line
Rows one to four are StockCharts' tests, row five is the TradingView author's, and row six is Kev's, from his VWAP pullback guide.
What is a trend line (trendline)?
StockCharts ChartSchool defines trend lines as "straight lines that connect two or more price points on a chart to identify and confirm trends," and calls them "a visual depiction of support and resistance levels in any time frame." Fidelity says nearly the same: "A trend line is a straight line that connects 2 or more price points." Both spellings are in use, so this page uses both.
A spreadsheet trendline, like the one Excel adds to a chart, is a different tool: a best-fit line calculated from all the data. A trader's trend line is drawn by hand through the swing points you choose. Since StockCharts says "Many of the principles applicable to support and resistance levels can be applied to trend lines as well," our support and resistance guide applies here too.
How do uptrend and downtrend lines work?
Kev (Kevin Cabana, who runs the Momentum trading room) defines the trend in our trend reversals guide: "An uptrend is a series of higher highs and higher lows, and pullbacks are what create the higher lows." A downtrend is the mirror image, which StockCharts' Dow Theory article describes as "declining peaks and declining troughs."
Uptrend line. It runs under the rising lows and acts as support. StockCharts: "As long as prices remain above the trend line, the uptrend is considered solid and intact."
Downtrend line. It runs over the falling highs and acts as resistance. For a long-only trader, a downtrend line is a reason to keep waiting on that stock. A break above it is a warning too: StockCharts says it "indicates that the net-supply is decreasing and that a trend change could be imminent." It puts the stock back on your watchlist.
How many touches make a valid trend line?
StockCharts states the rule in a box: "It takes two points to draw a trend line, and the third one confirms the validity." Fidelity and Investopedia give only the two-point minimum.
Past three touches, the sources split. StockCharts says more points add validity. The TradingView author, writing for mid- and long-term investors, argues the opposite: "From my psychological perspective, the more touches, the weaker the trendline becomes." No study we could read settles it, so this page sticks to StockCharts' boxed rule: the third touch confirms the line.
Should a trend line use wicks or bodies?
The sources differ. Investopedia: "Traders often select different data points: some use the lowest lows, while others prefer the lowest closing prices." StockCharts never names wicks, but its internal trend lines, drawn through the cluster of prices, "ignore these price spikes to a reasonable degree."
The TradingView author says to draw wick to wick or body to body, and calls a wick at one end and a body at the other a mistake. He also suggests: "If a chart offers a lot of huge panic-sell wicks, use bodies instead to get a cleaner setup." StockCharts' support and resistance article allows for small misses another way: "some traders and investors establish support zones."
What does a trend line break mean?
It is a warning. StockCharts: trend line breaks "should serve merely as a warning that a change in trend may be imminent." Fidelity: "When a trend line is broken, it should serve only as a warning that the trend may be changing."
What counts as a break. No source gives a tested rule. This page uses a simple one for the example below: a 5-minute candle that closes below an uptrend line is the warning. A candle that only wicks below and closes back above it has not broken the line.
The retest. StockCharts: "Once the price breaks below a support level, the broken support level can turn into resistance." On a rising trend line, a bounce that stalls under the broken line is that role reversal: the line acting as resistance.
If you hold a long. Investopedia: "If the price action breaches the trendline on the downside, the trader can use that as a signal to close the position." Kev's trend reversals guide gives the long-side response to any warning sign (it does not name trend lines): "For a long trader, warning signs mean tighten up, trim, or get out." Confirmation is a separate event: "a lower low on your timeframe, and price that stays below the level it broke."
What is a trend channel?
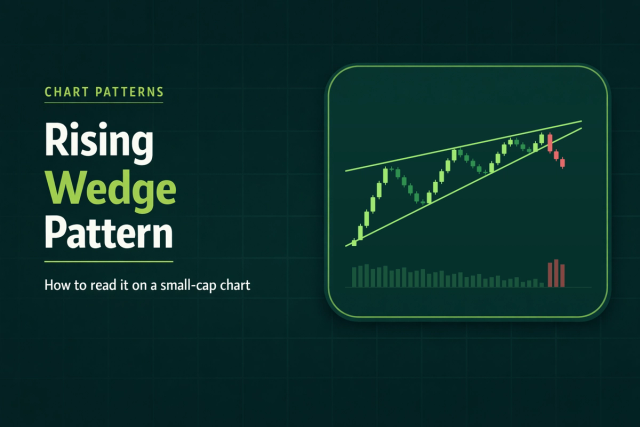
A second line drawn parallel to the trend line makes a channel. StockCharts: "A price channel is a continuation pattern that slopes up or down and is bound by an upper and lower trend line." When the two lines converge, the shape can be a wedge. Our rising wedge guide covers how to draw one without forcing it and when a close below its lower line counts as confirmation.
How do you use trend lines on a 1-minute or 5-minute chart?
Investopedia warns that "trendlines applied on smaller timeframes can be volume sensitive. A trendline formed on low volume may easily be broken as volume picks up throughout a session." On a small cap, the shift in volume from the premarket to the open is that case, so a line drawn on thin premarket bars is the one to doubt at 9:30. That application to the open is this page's.
Kev's timeframes guide: "A clean uptrend on the 5-minute chart may look like total chop on the 1-minute."
Confluence. Kev's VWAP pullback guide describes an entry where the pieces line up: "Trendline + VWAP line up," "Pullback forms a higher low right at that zone" and "Volume returns on the turn." His reason: "you’re not relying on one line; you’re trading a structure." His GNPX recap shows the same stacking, a double bottom and a VWAP reclaim with price back above a short-term trendline: "Once we reclaimed VWAP and broke back above the short-term trendline, I entered again." In both examples the trend line sits beside VWAP. The drawing rules on this page come from the sources named with them.
Do trend lines work?
No study we could read tests hand-drawn trend lines, on any timeframe or on small caps, so there is no success rate to quote. The nearest work is a 2000 NBER paper by Lo, Mamaysky and Wang, which tested ten chart patterns on daily U.S. stock data. Trend lines were not among them. Its warning applies to anything drawn by eye: "the presence of geometric shapes in historical price charts is often in the eyes of the beholder."
A worked example (hypothetical)
A made-up stock with round numbers, to show the steps. Nothing in it is a forecast or a real trade.
The line. On the 5-minute chart, a small cap prints swing lows at 9:45 ($2.40), 10:05 ($2.60) and 10:25 ($2.80), with a higher high between each pair. The first two lows draw the line and the third confirms it. The lows are four bars apart each time, so the spacing is even. The line rises $2.60 - $2.40 = $0.20 over 4 bars, or $0.05 per bar, and sits near $2.80 + 4 x $0.05 = $3.00 at 10:45.
The pullback. Price dips to $3.02 at 10:45 and the next candle closes back up at $3.05, with VWAP just under it.
The plan. Entry $3.05, stop $2.95, under both the line and the $3.02 low. Risk is $3.05 - $2.95 = $0.10 per share. Under the 1-2-3 rule, as the Momentum chatroom page states it, a trader should "never enter without a 2:1 reward to risk" and risk no more than 1% of the account. Two to one needs 2 x $0.10 = $0.20, so a first target at $3.25 or higher. A high of day at $3.30 leaves $3.30 - $3.05 = $0.25 of room, 2.5 to 1, so the plan clears the rule.
The break. At 11:00 the line sits near $3.00 + 3 x $0.05 = $3.15. A 5-minute candle closes at $3.08, $3.15 - $3.08 = $0.07 under it. That is the warning, and the $2.95 stop has not been touched, so a held long's plan is to tighten up, trim or get out. At 11:05 a bounce tops at $3.18, $0.02 under the line near $3.20, the broken line acting as resistance. A lower low under the $3.02 pullback low would be the structure confirmation.
Any trade can lose money, and a stop is not a guaranteed fill. Kev's stop-loss guide explains why it matters most on thin, fast stocks.
Frequently asked questions
What is a trend line, or a trendline?
Both spellings mean a straight line connecting two or more price points, under swing lows in an uptrend or over swing highs in a downtrend (StockCharts, Fidelity). A spreadsheet trendline is a best-fit line through all the data.
How many touches does a trend line need?
Two points draw the line, and in StockCharts' rule a third confirms it. Sources disagree on whether more touches make a line stronger, and no study we could read tests it.
Should a trend line use wicks or closes?
Sources differ. Investopedia says traders use either lows or closing prices. Pick one and use it for every point on the line, as a TradingView author writing for mid- and long-term investors advises. A line that starts on a wick and ends on a body is the mistake he warns about.
Do trend lines work?
No study we could read tests hand-drawn trend lines, so there is no success rate to quote. Use a line as a warning and check it against VWAP, moving averages and structure.
What is the best timeframe for trend lines?
No source tests it. Investopedia says lines on minute charts may need frequent readjusting. Kev calls the 5-minute chart "the main execution timeframe," so this page's example uses it.
What does it mean when price breaks a trend line?
StockCharts and Fidelity call it a warning that the trend may be changing, to be confirmed with other tools. Kev's reversal guide, which does not mention trend lines, says that for a long trader warning signs mean "tighten up, trim, or get out."
What is the difference between an uptrend line and a downtrend line?
An uptrend line connects rising swing lows and acts as support. A downtrend line connects falling swing highs and acts as resistance (StockCharts).
Is a moving average a trend line?
No. A moving average is calculated from recent prices and bends with them. A trend line is a straight line you draw through swing points you choose. Both can act as support, and Kev's support and resistance guide names them together: "A moving average or a trendline can act as dynamic support or resistance."
Watch the open with Kev
Kev trades the open live on stream in the Momentum trading room and calls out his entry and his stop on every trade, so you can see the thought process behind each decision. Membership includes the live stream and its recordings, the Momentum Scanner, the Momentum Journal, and the nightly and pre-market watchlists. Start your 7-day free trial. Cancel anytime.
This content is for educational purposes only and is not financial advice. Trading involves significant risk and may not be suitable for all traders.