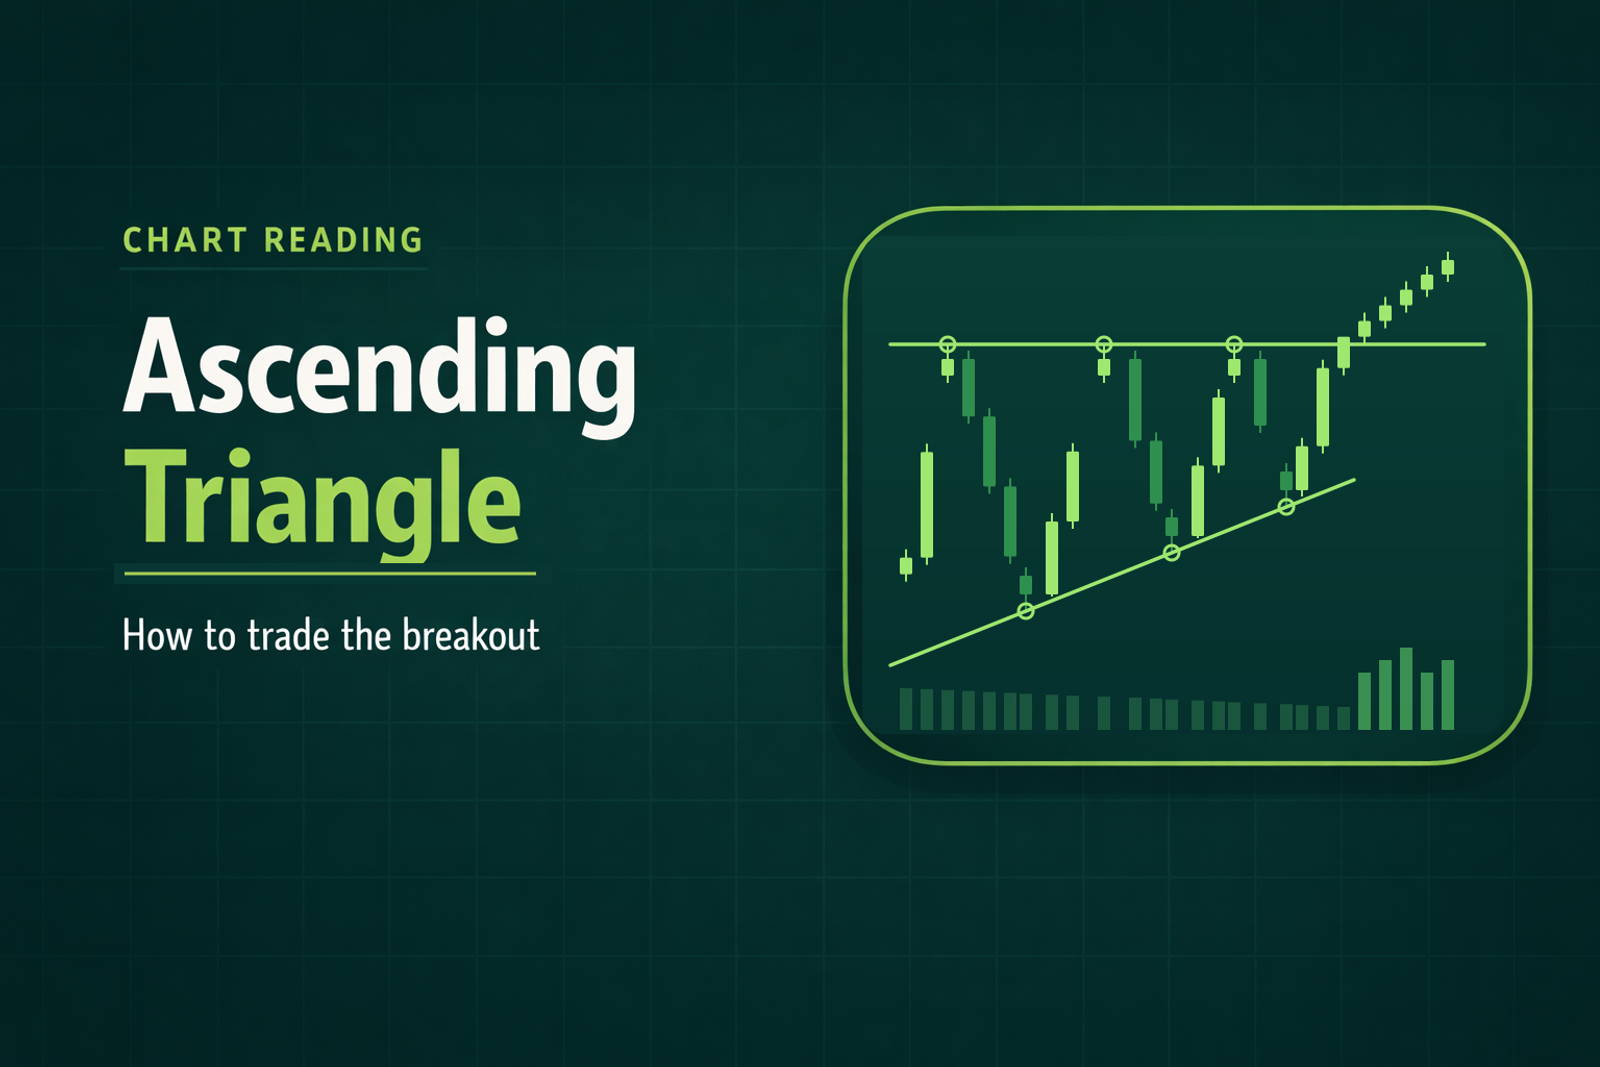
Short answer: An ascending triangle is a chart pattern with a flat top across equal highs and rising lows underneath. The breakout is a candle that closes above the flat top, ideally on expanding volume. A long-only trader buys only that upward break. A close below the rising line means no long.
Ascending triangle checklist
Before you call it a triangle, check each row.
Ascending vs descending vs symmetrical triangle (and rising wedge)
What is an ascending triangle pattern?
An ascending triangle forms when price keeps running into the same ceiling while each pullback holds higher. StockCharts' ChartSchool describes the shape: "Two or more equal highs form a horizontal line at the top. Two or more rising troughs form an ascending trend line that converges on the horizontal line as it rises." It also calls the pattern a right-angle triangle.
The bullish bias comes from the lows. StockCharts says "It's these higher lows that indicate increased buying pressure and give the ascending triangle its bullish bias."
Sources differ on context. StockCharts says the pattern "usually forms as a continuation pattern during an uptrend." Bulkowski accepts any prior direction, and in his daily-chart data it broke upward 63% of the time, so by subtraction it broke down the other 37%. A break down means no long.
How many touches make an ascending triangle valid?
StockCharts and Investopedia ask for two highs and two lows. Bulkowski says "Price must touch one trendline at least three times, the other at least twice" and does not say which line gets three.
Our trend lines guide follows StockCharts' rule that two points draw a line and a third confirms it. The worked example below puts its third touch on the flat top, which also meets Bulkowski's three-on-one-line rule. No study we found tests whether that third touch changes the odds. StockCharts adds one hard rule: if a newer low is "equal to or less than the previous reaction low," the triangle is "not valid."
What confirms the breakout?
A close above the flat top. Bulkowski: "An upward breakout happens (to the right of A) when the stock closes above the top trendline."
Volume. It usually contracts inside the pattern. StockCharts calls an expansion on the upside break "preferred" and "not always necessary." Investopedia is firmer: "If the price breaks out on low volume, that is a warning sign that the breakout lacks strength." Momentum's small-cap trading guide goes further for its flat top breakout: "That volume confirmation is non-negotiable."
The retest. StockCharts says the broken ceiling "turns into support." In Bulkowski's daily, bull-market data, price returned to the breakout price within 30 days 64% of the time, and "Throwbacks and pullbacks hurt post breakout performance."
Kev (Kevin Cabana, who runs the Momentum trading room) lists three entry models in his breakout trading guide, and two fit here: enter on the retest once the break holds, or enter on the break when volume confirms. He flags the second as bringing more fakeouts. Our support and resistance guide explains why a broken ceiling turns into a floor.
How do you set a target on an ascending triangle?
The textbook version is StockCharts': "the price projection is found by measuring the widest distance of the pattern and applying it to the resistance breakout."
Bulkowski scales it down. He multiplies the height by the "percentage meeting price target" before adding it. For upward breakouts that percentage is 70%, from his daily-chart, bull-market table of more than 1,400 patterns. It is a count across his whole sample: the share of upward breakouts that reached the full-height target.
StockCharts says targets "are only meant to be used as guidelines." Of the three profit options in Kev's breakout guide, the partials one puts the next resistance first and the measured move second.
Where does the stop go?
Sources give two places, far apart.
- Under the pattern. Bulkowski: for an upward break, "a stop at any of the minor lows on side A would work well." The closest of those is just under the last higher low.
- Just under the flat top. Momentum's small-cap trading guide sets the stop for its flat top breakout "just below the breakout level, typically two to five cents under the flat top price that was just broken."
The tight stop allows more shares at the same 1% risk, but it sits where a retest of the broken ceiling lands. The worked example below runs the numbers on both.
When does an ascending triangle fail?
False breakouts. Investopedia: "The main problem with triangles, and chart patterns in general, is the potential for false breakouts."
The numbers, with scope. Bulkowski's table is headed "Ascending Triangle: Important Bull Market Results." It covers daily charts, measured to the ultimate high or low. His glossary defines the ultimate high as "the highest peak before price declines by at least 20%," so it is known only in hindsight. In the table, 17% of upward breakouts failed to rise at least 5%. From his daily data, he also reports that almost half (46%) of ascending triangles that broke down busted and moved higher. For a long-only trader, the response to a break down is to keep watching for a fresh close above the flat top.
His own verdict. From his trading tests: "Due to the shortcomings of the chart pattern, this is not the best trading setup." None of this is a Momentum result or a win rate, and the shape alone is no edge.
What do descending and symmetrical triangles mean for a long-only trader?
Descending triangle. StockCharts calls it "a bearish formation": a flat bottom under falling highs. For a long-only trader that means no long yet. In his daily data, Bulkowski reports the breakout was "upward 53% of the time," so the shape gives no reliable direction. He also says the pattern "confirms as a valid one when price closes outside one of the trendlines," so the first thing to act on is a close above the falling top line.
Symmetrical triangle. Highs fall and lows rise. StockCharts says "The future direction of the breakout can only be determined after the break has occurred." It cites Edwards and Magee's 1948 book for "roughly 75% of symmetrical triangles are continuation patterns and the rest mark reversals." That figure counts how often the break followed the prior trend. In his daily data, Bulkowski found upward breaks 60% of the time and called its performance "awful." A long-only trader waits for the close and takes only the upward one.
Can you trade an ascending triangle on a 1-minute or 5-minute small-cap chart?
No source we found tests ascending triangles on 1-minute or 5-minute charts, or on small caps. Bulkowski's numbers come from end-of-day data: "I use end-of-day data for my tests because that's what I have available." A 2000 NBER paper by Lo, Mamaysky and Wang studied daily U.S. stock returns from 1962 to 1996 without testing ascending triangles or intraday charts. It found that several chart patterns carried some information, and it names one of the main obstacles to testing them: "the presence of geometric shapes in historical price charts is often in the eyes of the beholder."
So treat what follows as a framework to test on a simulator. Kev says the same in his morning trend continuations guide: "The pennant and the ascending triangle are textbook continuation patterns I'm including so you recognize them. They aren't setups from my recaps, so treat them as examples to adapt and test them on a simulator before you trade them." The same guide adds that "on a 5-minute chart they are compressed adaptations."
Momentum's small-cap guide teaches a related setup, the flat top breakout: "price has tested a resistance level multiple times, and buyers are building pressure beneath it." The guide's rule is to enter long on the first candle close above the flat top resistance when breakout-candle volume is at least three to five times the average. An ascending triangle's top line is that same flat top, and the rising lows underneath are what the triangle adds.
Halts and pauses. A fast small cap can run into its price band. The LULD Plan says "If the market does not exit a Limit State within 15 seconds, the primary listing exchange declares a five-minute Trading Pause," during which a stop cannot fill, and the reopen can gap past it. A Limit State is the plan's name for price pinned at the band. Kev's halted stock guide: "I do not buy into the halt, and I do not buy the first tick of the reopen."
A worked example (hypothetical)
A made-up small cap with round numbers. Nothing in it is a forecast or a real trade.
The pattern. After a morning run, the stock tops at $5.00 three times on the 5-minute chart, at 9:45, 10:05 and 10:25. The pullback lows rise: $4.60 at 9:50, $4.75 at 10:10 and $4.85 at 10:30. The widest height is $5.00 - $4.60 = $0.40.
The break. At 10:45 a 5-minute candle closes at $5.05 on rising volume, so the entry is $5.05. The 1-2-3 rule, as Momentum's chatroom page states it, says to risk no more than 1% of the account and never to enter without 2:1 reward to risk. On a $20,000 account, 1% is 0.01 x $20,000 = $200.
Version A fails the rule. The full-height target is $5.00 + $0.40 = $5.40, only $0.35 above the entry. Bulkowski's scaled target is $0.40 times 0.70 = $0.28, so $5.28, which is $0.23 away and 1.10 to 1. Your choice is to pass, or to wait for a retest and redo the math.
Version B passes on paper, with three weak points. The $10,100 position puts 50.5% of the account in one stock. The tighter the stop, the bigger that slice gets, so size to whichever is smaller: what the 1% rule allows or what your buying power covers. A retest to $4.97 leaves only $0.02 above the stop. And if the stop filled at $4.90, the loss would be ($5.05 - $4.90) x 2,000 = $300, or 1.5% of the account. The SEC's Investor.gov warns that a stop fill "may differ from the stop price, especially in a fast-moving market."
Frequently asked questions
Is an ascending triangle bullish?
Its textbook bias is bullish: StockCharts calls it "a bullish formation." In Bulkowski's daily-chart data it broke upward 63% of the time, so by subtraction 37% broke down. A long-only trader buys only a close above the flat top.
How many touches does an ascending triangle need?
StockCharts asks for two on each line. Bulkowski asks for three on one and two on the other. StockCharts' trend line rule treats a third touch as the confirmation.
What is the target for an ascending triangle?
The textbook target is the widest height added to the breakout price. Bulkowski multiplies that height by 70%, the share of upward breakouts in his daily-chart, bull-market sample that reached the full-height target.
What is the difference between an ascending triangle and a rising wedge?
Look at the top line first. In an ascending triangle it is flat and the bias is bullish. In a rising wedge it climbs, though more slowly than the bottom line, and the bias is bearish. Both have rising lows.
Is a descending triangle bullish?
Its textbook bias is bearish: StockCharts calls it "a bearish formation," a flat bottom under falling highs. In Bulkowski's daily data it still broke upward 53% of the time, so the shape gives no reliable direction. For a long-only trader it means no long until price closes above the falling top line.
Does an ascending triangle work on a 5-minute chart?
No source we found tests it. Kev calls a triangle on a 5-minute chart a compressed adaptation of the textbook version, to be tested on a simulator first.
What happens if an ascending triangle breaks down?
A close below the rising line means no long. In Bulkowski's daily data, 63% broke upward, so by subtraction 37% broke down, and 46% of those downward breaks busted and moved higher. Keep watching for a fresh close above the flat top.
Watch the open with Kev
Kev trades the open live on stream in the Momentum trading room and calls out his entry and his stop on every trade, so you can see the thought process behind each decision. Membership includes the live stream and its recordings, the Momentum Scanner, the Momentum Journal, and the nightly and pre-market watchlists. Start your 7-day free trial. Cancel anytime.
This content is for educational purposes only and is not financial advice. Trading involves significant risk and may not be suitable for all traders.