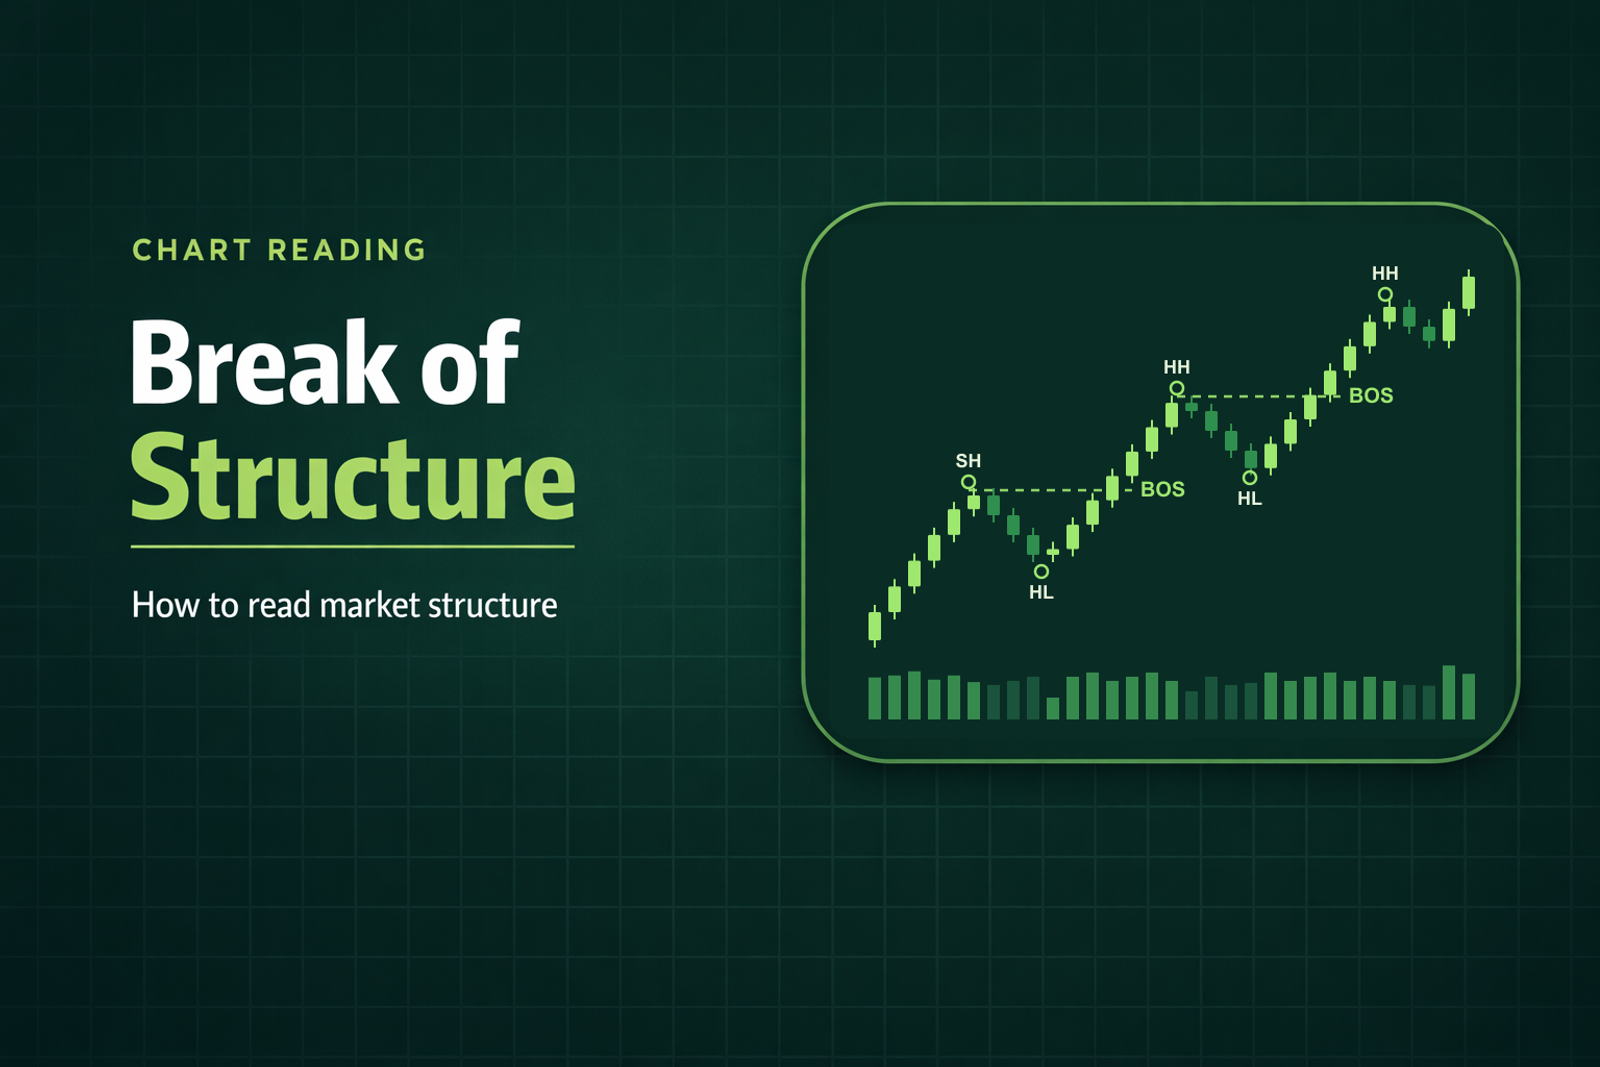
Short answer: A break of structure (BOS) is a candle close beyond the last swing point in the trend's direction. Market structure is the sequence of swing highs and lows. A change of character (CHoCH) is the first break against the trend. For a long-only trader, a bullish BOS confirms the uptrend and a CHoCH means exit and take no new longs.
BOS vs CHoCH vs MSS vs wick-only break
These terms are trader jargon used in the smart money concepts (SMC) and ICT (Inner Circle Trader) communities, and none of the reputable references we read defines them. The practitioner pages below (Flux Charts, FXOpen, Alchemy Markets, Strike, DailyPriceAction, LuxAlgo, Bookmap and Tradingsim) are quoted for usage only. This table sets out the convention this page uses. Kev (Kevin Cabana, who runs the Momentum trading room) and Momentum have not tested it as a rule.
The close rule matches Strike and DailyPriceAction. The CHoCH level is Alchemy Markets' last higher low. DailyPriceAction is stricter and counts only the swing that produced the last BOS.
How to mark market structure on a 5-minute chart
Is this a valid BOS?
Check the Level, Close and Higher low rows before you call it a BOS. Hold is an extra test from Strike, and Room is a check on the trade.
What is market structure in trading?
Market structure is the order of swing highs and swing lows on your chart. It shows whether a stock is trending up, down or sideways. Bookmap, an order-flow software vendor, calls it "The framework or structure that any given market is currently trading in."
StockCharts' ChartSchool gives the anchor definitions: "An uptrend is defined by prices that form a series of rising peaks and rising troughs (higher highs and higher lows)," and a downtrend is "a series of declining peaks and declining troughs (lower highs and lower lows)." Fidelity agrees: "An uptrend is made up of ascending peaks and troughs." Our trend lines guide covers drawing lines through these points.
What are swing highs and swing lows?
A swing high is a peak above the prices around it, and a swing low is a trough below them. Investopedia says swing lows "are subjective" and depend on the time frame the observer prefers, so two traders can mark different swings on one chart.
A common convention is two candles on each side of the swing. Investopedia's fractal article describes the same five-bar shape and its lag: "The pattern still needs two more bars on the right to be confirmed." On a 5-minute chart that is a 10-minute wait, so a swing is known only after the fact, and the stop goes under a confirmed higher low.
What is a break of structure?
A break of structure is the trader's term for price breaking the last swing point in the direction of the trend, which signals continuation. Alchemy Markets: "In simple terms, a BOS happens when price closes beyond the last swing high or low."
StockCharts does not use the term, so the link to Dow Theory is this page's own. In Dow Theory an uptrend is a series of "rising peaks and rising troughs," so each new peak above the last one, after a higher low, is the step traders call a bullish BOS. StockCharts' Dow Theory examples chart daily closing prices. Strike adds that "the BOS is not considered an entry signal."
What is a change of character (CHoCH), and how is it different?
Sources agree a CHoCH is the first break against the trend, and differ on which swing has to break:
- Flux Charts: "A change of character (CHoCH) is formed when a Break of Structure (BOS) fails to form."
- Alchemy Markets: price "drops below the last higher low (HL)."
- DailyPriceAction, the strictest: "A valid CHoCH must break the swing that produced the last BoS."
This page uses Alchemy's version: a bearish CHoCH is the first 5-minute close below the last confirmed higher low. DailyPriceAction's stricter rule waits for the swing that produced the last BOS, which can sit lower. Alchemy's version fits Dow Theory, where an uptrend is "considered in place until a lower low forms," and Investopedia's uptrend article, which says of a lower swing low in an uptrend: "Traders use this as an exit signal."
Kev's reversal guide separates a warning from a confirmation: "A lower high is the first crack in the structure," and "Confirmation is structure: a lower low on your timeframe, and price that stays below the level it broke." Matching his confirmation step to the CHoCH label is this page's mapping. His step also waits for price to stay below the level, so a first close below can come before his confirmation. A lower high alone stays a warning here. Alchemy Markets calls a CHoCH "an early signal that structure is weakening." This page still treats it as the exit, because the stop sits under the same higher low.
What is a market structure shift (MSS)?
MSS is ICT vocabulary that overlaps CHoCH. FXOpen: "An ICT MSS forms when a market fails to extend its current trend and then breaks a key swing point with displacement," meaning a large, fast candle through the level. LuxAlgo, a charting vendor, advises: "State the chosen convention before comparing examples." That is the approach here, so this page treats an MSS as a stricter CHoCH with the same exit.
Does a wick count, or does the candle have to close?
Most pages ask for a close. DailyPriceAction: "You need a body close." FXOpen says a wick "might simply be an attempt at a liquidity grab," a quick poke through a level that reverses.
This page's convention is a 5-minute close above the last confirmed swing high. A wick that closes back below is a failed breakout. On a thin, low-float stock (one with few shares available to trade) a single wick can print a spike that looks like a BOS, so the close rule screens out wick-only spikes. A spike that also closes above the swing high still passes it.
How does a long-only trader use a break of structure?
Kev trades long only, so this page has no short side. The long-only read has five steps.
- A bullish BOS says the uptrend is alive. The entry waits for step 2.
- Wait for the next pullback that holds a higher low. That is this page's convention. Kev's pullback guide describes the step after a pullback: "After a pullback, price sets a higher low and then breaks above the prior candle's high with a strong close."
- Put the stop under the higher low. Kev's pullback guide puts the stop "under the higher low." For a stop under VWAP (the session's volume-weighted average price) and the swing low, the same guide says: "If price breaks the swing low and loses VWAP on volume, buyers failed."
- Treat a CHoCH as the exit. Take no new longs in that stock.
- Size from the stop. The 1-2-3 rule, as Momentum's chatroom page states it: risk no more than 1% of the account on one trade, never enter without 2:1 reward to risk, and stop trading for the day after 3 losses.
Which timeframe do you mark structure on?
No source sets the correct one, and Dow Theory was built for slower charts. StockCharts says that "Hamilton and Dow were interested in catching the big moves and would have been apt to use weekly charts to establish reaction highs and lows." Marking swings on a 5-minute chart is an adaptation, so Dow Theory does not vouch for it on intraday charts.
Kev's 5-minute chart guide states the trade-off: "On faster charts, structure breaks constantly. On slower charts, it appears too late."
Does break of structure work?
No test we could read measures it. No page that defines BOS, CHoCH or MSS shows the test behind a success rate, and nothing we found tests them on 1-minute or 5-minute charts or on small caps. A 2000 NBER paper by Lo, Mamaysky and Wang tested ten named patterns on daily U.S. stock data from 1962 to 1996, and BOS was not one of them. It names a main obstacle: "the highly subjective nature of technical analysis." Marking swings is the subjective step, so this page fixes a bar count and a chart.
A halt prints no candles, so a BOS across a halt gap skips the bars that would show the break holding. The LULD Plan says "If the market does not exit a Limit State within 15 seconds, the primary listing exchange declares a five-minute Trading Pause," and a stop cannot fill during the pause. A Limit State means price is pinned at its band.
A worked example (hypothetical)
A made-up small cap on the 5-minute chart. Nothing here is a forecast, a real trade or a result.
The swing high. The 9:45 candle tops at $4.00, above the two candles before it, and the 9:50 and 9:55 candles both make lower highs. The swing is confirmed when the 9:55 candle closes, 2 x 5 = 10 minutes after the 9:45 candle closes.
The higher low and the wick. Price pulls back to $3.70 at 10:05, above the prior swing low, confirmed when the 10:15 candle closes. The 10:15 candle wicks to $4.04 and closes at $3.97, back under $4.00, which is no BOS under the close rule.
The BOS. The 10:20 candle closes at $4.08, above $4.00, with the $3.70 higher low intact. That is a bullish BOS.
The pullback. Price reaches $4.40 at 10:30. The dip then holds $4.02 at 10:45, above the old $4.00 swing high, a new higher low confirmed when the 10:55 candle closes.
The exit trigger. The plan names it before the entry. The last confirmed higher low is $4.02, so a 5-minute close below $4.02 is the CHoCH: exit if the $3.99 stop has not already filled, and take no new longs in this stock. As each new higher low is confirmed, the CHoCH level moves up to it.
The entry and the stop. The entry is $4.10 as price turns up after the 10:55 candle closes, with the stop at $3.99, under the $4.02 higher low and under $4.00.
The plan passes the 2:1 check. The position puts 37.3% of the account in one stock. The tighter the stop, the bigger that slice gets, so size to whichever is smaller: what the 1% rule allows or what your buying power covers.
The slippage check. Kev's stop-loss guide warns, "A stop-loss limits your loss, but it doesn't guarantee the exact price you'll get." If the $3.99 stop filled at $3.94, the loss would be ($4.10 - $3.94) x 1,818 = $290.88, or 1.45% of the account.
Frequently asked questions
What does BOS mean in trading?
BOS means break of structure: a candle close beyond the last swing high or low in the trend's direction, read as continuation. For a long-only trader a bullish BOS confirms the uptrend. Strike says it mainly defines trend bias, with the entry coming after a retrace.
What is the difference between BOS and CHoCH?
A BOS breaks the last swing point with the trend and signals continuation. A CHoCH is the first break against it. Here, a bearish CHoCH is the first 5-minute close below the last confirmed higher low: exit and no new longs.
Is a wick a break of structure?
On this page, no. A BOS needs a candle to close beyond the last confirmed swing high. DailyPriceAction says "You need a body close."
What timeframe is best for break of structure?
Sources do not agree on one. DailyPriceAction prefers the 1-hour chart, and other practitioners mark structure on many timeframes. This page uses the 5-minute chart as its own choice.
Is break of structure a good strategy?
No test we could read measures it. No page that defines BOS shows the test behind a success rate, and none tests it on 5-minute charts or small caps. Use it to describe the trend, with the stop and the 1% rule doing the protecting.
Can you trade break of structure on small caps?
No source we found tests it on small caps or on 1-minute and 5-minute charts. Halts print no candles, and a thin one-candle spike can look like a BOS. On those stocks the close rule screens out wick-only spikes, and the stop under the higher low sets the risk.
Watch the open with Kev
Kev trades the open live on stream in the Momentum trading room and calls out his entry and his stop on every trade, so you can see the thought process behind each decision. Membership includes the live stream and its recordings, the Momentum Scanner, the Momentum Journal, and the nightly and pre-market watchlists. Start your 7-day free trial. Cancel anytime.
This content is for educational purposes only and is not financial advice. Trading involves significant risk and may not be suitable for all traders.