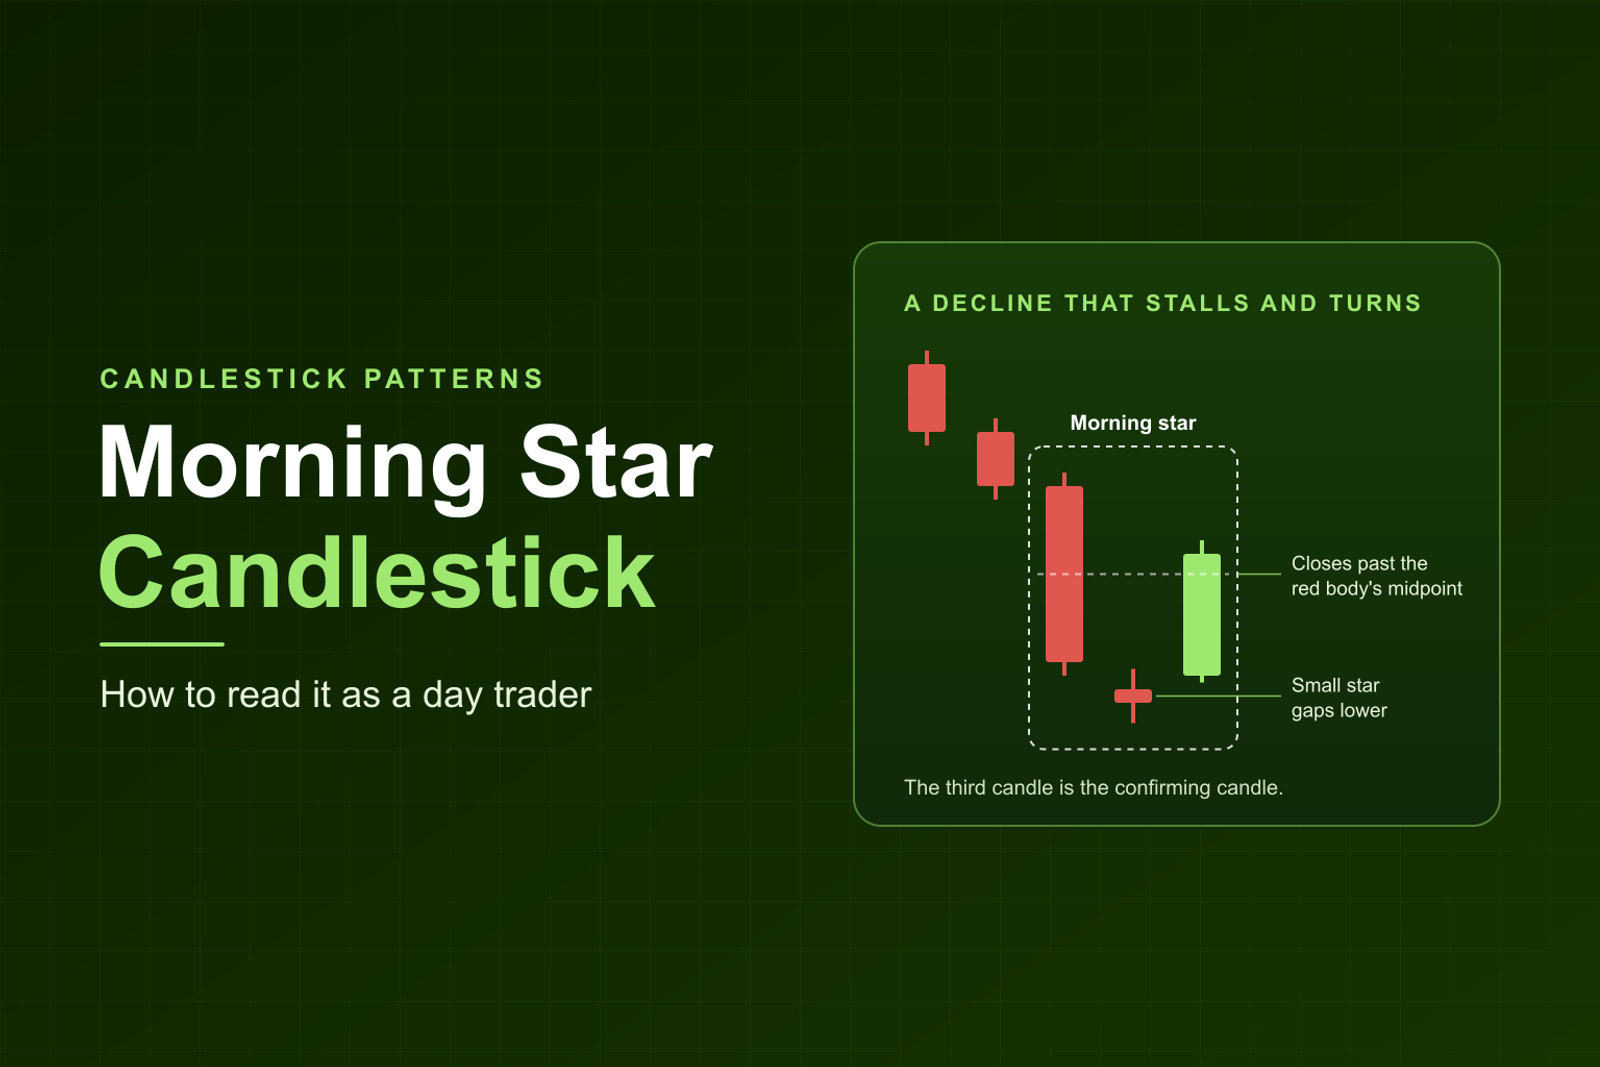
Short answer: A morning star is a three-candle bullish reversal pattern that forms after a decline. A morning star is a long red candle, then a small candle that gaps below it and shows indecision, then a long green candle that closes at least halfway into the red body. The third candle is the confirmation. On daily charts, the pattern researcher Thomas Bulkowski finds a bullish reversal 78% of the time. It is not a win rate.
Kev (Kevin Cabana, who runs the Momentum trading room) trades long only: every trade he takes buys a stock he expects to rise. So this page asks what a morning star means for someone holding or planning a long. It goes deeper than our guide to candlestick patterns, with the same definition and numbers. A stop is the price where you exit a trade that goes against you. A stock in play is a stock already moving on heavy volume. A level is a price traders already watch, such as support or a premarket high. A doji is a candle with a body no bigger than 5% of its range. A gap here means one candle's body sits fully below or above the previous candle's body, with space between them.
Is it a morning star?
The first five rows decide whether three candles have the shape. The last row is this page's day-trading addition.
What is a morning star candlestick?
It is a three-candle bottom pattern. Bulkowski, whose test results come up below, writes the first two like this: "Look for a tall black candle in a downward price trend. Following that, a small bodied candle of any color appears, one whose body gaps below the prior body." Then the third: "The last day is a tall white candle that gaps above the body of the second candle and closes at least midway into the body of the first day." He means red and green.
StockCharts describes the same shape, and the name comes from the middle candle. StockCharts: "A candlestick that gaps away from the previous candlestick is said to be in a star position."
Investopedia puts it in plain terms: "The morning star pattern consists of three candles: a tall black candlestick, a smaller candle indicating market indecision, and a tall white candlestick confirming the reversal." It adds a detail that matters for the stop later: "A morning star is a three-candle pattern with the low point on the second candle; however, the low point is only apparent after the close of the third candle."
The three candles, one by one
The first candle is a tall red body that extends the decline, with sellers still in control. Bulkowski's tip: "Select tall candles for the best performance."
The star is where the selling stalls. Its color does not matter, but its body has to be small. If the open and close are nearly equal, it is a doji, and the pattern gets its own name.
The third candle does the work. Our guide says it plainly: "A morning star already carries its own confirmation: the third candle is the confirming candle." Bulkowski scores his tests from the breakout, which he defines this way: "Price breaks out upward when it closes above the top of the candlestick pattern." That close is how he counts a reversal in his data; this page needs no fourth candle to call the pattern complete.
Does a morning star need a gap?
In the textbook rule, yes. Bulkowski requires the star's body to gap below the first body and the third body to gap above the star's. StockCharts describes the same two gaps at the open: a middle candle that "gapped down on the open" and a third candle that "gapped up on the open". Our guide's definition says the small candle "gaps below" the red one, and this page keeps that as the definition.
A relaxed reading drops the gap, and this page labels it a variant. It comes from markets that trade around the clock. LuxAlgo: "In 24-hour markets true gaps are rare, so most modern definitions relax the gap requirement." The site kagels-trading.com writes: "In the ideal drawing the bodies are separated, but our rule requires no gap." It adds: "Not every classic definition requires both gaps, and Steve Nison describes looser forms as well."
US stocks sit in between. A stock can gap overnight and at the open, so the two-gap version can print on a daily chart. On a 5-minute chart mid-session, each bar usually opens near the last close, so the gapped version is rare intraday. That last point is this page's own observation; we found no source that measures it. So call a no-gap 5-minute morning star the relaxed variant, and lean harder on where it forms. LuxAlgo warns that "intraday prints are frequent and need stricter location filters."
Morning star vs morning doji star
A morning doji star is a morning star whose middle candle is a doji. Our doji candlestick page defines a doji as "a body no bigger than 5% of the candle's range". Bulkowski's identification: "Look for a tall black candle in a downward price trend. The next day, a doji appears and its body gaps below the prior candle's body." And: "The final day is a tall white candle whose body gaps above the doji's."
Bulkowski: "The morning doji star is supposed to act as a bullish reversal and it does 76% of the time, confirmed by testing 932 examples." He flags the sample: "That is well short of the 20,000 that I usually like to dissect." The morning star's 78% comes from a different sample, so a two-point gap is no reason to call either one better. Our doji page says it too: "Our candlestick guide covers the multi-candle patterns, and a three-candle result is a different number from a doji result."
The bullish abandoned baby is the rare cousin. Bulkowski: "The bullish abandoned baby looks similar, but is rare." In it, the doji's whole range, wicks included, gaps away from both neighbors. He writes: "Following that, a doji should appear that gaps below the two adjacent candle shadows." In a morning star, only the bodies gap.
How is a morning star different from similar patterns?
Every figure is Bulkowski's, on daily charts. Reversal in his language is the direction of the first close beyond the pattern. It says nothing about profit. Three white soldiers posts the highest rate here, and our guide carries Bulkowski's caution that the soldiers' number runs high because of how he scores a reversal.
How reliable is a morning star?
Bulkowski's ThePatternSite is the one source we found that publishes tested figures for this exact pattern. The percentages below count which way price first closed beyond the pattern on daily charts in his database. The ranks are out of 103 candlestick patterns, and a rank of 1 is the best.
In his glossary, a reversal is "When price enters and exits a chart pattern in opposite directions." A 78% reversal rate is 28 points better than a coin flip. Bulkowski writes the morning star acts as "a bullish reversal 78% of the time. That ranks 6th where 1 is best out of 103 candlestick types." So the pattern carries three different ranks: 6th for the reversal rate, 66th for frequency and 12th for overall performance. Name the one you mean.
On the move after the breakout: "That tells me the trend after the breakout from a morning star takes a while to get going but it tends to keep moving up." And: "Patience is probably a good word for what you need when trading this candle pattern." That patience is about the trend on daily charts. It is no holding rule for a day trade.
Three limits apply.
- Daily charts. His examples are daily: "The morning star candlestick appears circled in red on the daily scale." Our guide says the same: "Bulkowski's published testing is built on daily charts." It is no day-trading win rate.
- Perfect trades. In his words, "The above numbers are based on hundreds of perfect trades." They say nothing about entries, stops, slippage (the gap between the price you expect and the price you get) or size.
- Rarity. kagels counted cases on daily charts under its own rules: "We found 4 to 9 morning stars per market in the DAX, S&P 500, EUR/USD and Gold from 2014 to September 2026." It publishes no hit rate: "Below 30 cases we do not compute a hit rate or an average."
The one intraday academic test we found, on DAX and Bund futures, found no evidence that candlestick patterns predicted price (Fock, Klein and Zwergel, Journal of Derivatives, 2005, by our paraphrase of the abstract). It does not name the morning star.
How do you confirm a morning star?
The third candle is the confirmation. That matches our guide. StockCharts writes "Bullish confirmation could come from a gap up, long white candlestick, or advance above the long black candlestick's open", and in a morning star the long white candle is the third candle itself. Until it closes, you have a red candle and a pause. Waiting for a break of the third candle's high is a stricter variant some traders use.
Volume helps the read. Investopedia: "Traders look for volume increases, especially on the third day of the pattern, to confirm the strength of a morning star." Those are daily candles. On a 5-minute chart, the same idea is volume rising into the third candle; that translation is this page's reading.
Location matters as much. Investopedia: "A morning star is most effective when supported by volume and other indicators, like a support level." It warns that "it’s easy to mistakenly see morning stars in any downtrend." Bulkowski's location tips are daily-chart tips. For the morning star: "Morning star candles that appear within a third of the yearly low perform best". He also writes: "Look for the morning star candlestick to appear in a downward retrace of the primary uptrend for the best performance". The primary trend is the stock's longer-term direction.
Where does a morning star matter for a day trader?
At a level, on a stock in play. Kev's pattern roundup gives his rule for single-candle signals in one line: "A hammer or engulfing candle earns attention only at a level on a stock in play." The same rule applies here; that is this page's reading, because the line names the hammer and the engulfing candle. A level is a price traders already watch, such as support, resistance, VWAP (the session's volume-weighted average price) or a premarket high. Our hammer candlestick page covers the single-candle version of a bottom.
The roundup also says "Reliability comes from four conditions: a stock in play, a level to lean on, the first two hours of the session, and a market hot enough to follow through." Kev's own window: "I trade from 9 to 11am, and then I stop." And: "No pattern carries a dependable win rate by itself."
Bulkowski's best-case setting on daily charts has the same shape as Kev's pullback method: a stock in an uptrend that dips and then shows buyers at a level. Our pullback trading strategy has the full method.
What does a long-only trader do with a morning star?
It is a possible trigger only when it fits Kev's trigger rules. His pullback page says "Enter only when a trigger candle confirms buyers are stepping in (the three I allow are below)." None of the three is named morning star. The closest is "Trigger 2: Higher low confirmed by a breakout candle." He describes it as "After a pullback, price sets a higher low and then breaks above the prior candle’s high with a strong close."
A morning star whose third candle closes strong at a level, above the star's high, can fit that description. Reading it as one form of his breakout-candle trigger is this page's mapping, and Kev has not labeled it that way.
Then the risk rules. Kev's chatroom page states them: "The 1-2-3 rule: risk no more than 1% of the account, never enter without 2:1, and stop for the day after 3 losses." A 2:1 trade has a target at least twice as far from the entry as the stop. The natural stop sits under the star, because Investopedia puts the pattern's low point on the second candle.
The evening star: the mirror on a long you hold
Our guide describes it: "The evening star is the mirror image at a top: the small candle gaps above a long green candle, and a long red candle closes at least halfway down the green body." Bulkowski reports it acting "as a bearish reversal of the upward price trend 72% of the time. That gives it a rank of 10th, which is high." It holds frequency rank 71 and overall performance rank 4, the same row our shooting star page carries.
That rank 4 needs care. Bulkowski says most of the evening star's overall performance comes from upward breakouts, so the rank says little about how far price falls after one.
For a long-only trader, there are two cases, and neither is a short entry.
- You hold a long. On this page an evening star means exit, tighten the stop, or do not add. Kev's own exit rule covers a smaller shape, the topping tail: "The exit rule: price tries to break out and instantly rejects (topping tail) = full exit, every single time, no exceptions." An evening star is a failed push higher spread across three candles. Pairing the two is this page's reading, and Kev has not said he exits on an evening star.
- You were going to buy there. Take no new long into it and do not chase.
A hypothetical worked example
Every number here is made up, on a made-up stock. This is a hypothetical that computes risk only. It is not a trade, and it shows no forecast and no result.
On a 5-minute chart, a stock in play has pulled back to a level inside an uptrend. A red candle opens at $4.20 and closes at $3.95, a $0.25 body. The star opens at $3.93, trades from $3.86 to $3.96, and closes at $3.91. Its body, $3.91 to $3.93, sits below the red body. The green candle opens at $3.95, trades from $3.94 to $4.14, and closes at $4.12. Its body sits above the star's body, and it closes above the red body's midpoint of $4.075. It passes Bulkowski's body-gap rule and our guide's "at least halfway" line. Both body gaps here are two cents; on a real 5-minute chart, the relaxed no-gap version is more common.
Now the risk. A long is taken on the third candle's close at $4.12, with the stop one cent under the star's low at $3.85. The risk is $0.27 a share. On a $10,000 account, the 1% in Kev's 1-2-3 rule is $100 of risk. Our position size guide gives the formula: "Position size is your dollar risk divided by your risk per share." So the size is $100 divided by $0.27, which is 370 shares after rounding down. The 2:1 floor puts the first target at $4.66, which is $4.12 plus two times $0.27.
The stricter variant waits for a break of the third candle's high, with an entry at $4.15. The risk is then $0.30 a share, the size 333 shares, and the 2:1 target $4.75. The stop sits under a tall pattern, so the risk per share is wide and the size shrinks.
The pattern has failed if price closes back below the star's low. A stop does not promise a price either. Our stop-loss guide puts it this way: "A stop-loss limits your loss, but it doesn't guarantee the exact price you'll get."
When does a morning star fail?
- There is no decline before it. With nothing to reverse, three candles in a range are noise.
- The candles are the wrong size. A short first candle or a big star breaks the shape.
- The third candle stops short of the midpoint. It has not taken back enough of the red body.
- It forms in the middle of nowhere. With no level under it, there is nothing to lean on.
- Price closes back below the star's low. That is the failure on this page.
- The third candle fades. Kev's pullback page warns about "a single green candle that immediately gets rejected".
Morning star candlestick: frequently asked questions
What does a morning star candlestick indicate?
A possible bullish reversal after a decline. Sellers push a tall red candle, the selling stalls in a small star, and buyers close a tall green candle at least halfway into the red body. It is a reason to look closer at the level it formed on.
Is a morning star bullish or bearish?
Bullish. Investopedia: "A morning star is a bullish candlestick pattern recognized by traders for signaling a potential trend reversal in a downtrend." Its bearish mirror at a top is the evening star.
Does the middle candle have to be a doji?
No. The star can be any small body of any color. When it is a doji, the pattern is a morning doji star. Bulkowski tested it at a bullish reversal 76% of the time on daily charts.
What is the 3 candle rule?
No source we found defines one standard three-candle rule. The phrase fits any pattern read from three candles together, where the third candle confirms or rejects the first two. In a morning star, the third candle is the confirmation. Our guide puts the three-candle patterns side by side.
How reliable is the morning star pattern?
On the daily charts Bulkowski tested, it reversed upward 78% of the time, ranking 6th of 103 on that measure. That says nothing about entries, stops, intraday charts, small caps or any trader's results.
Does a morning star work on a 5-minute chart?
The shape prints on any timeframe, but no published test we found measures it on 5-minute stock charts. By this page's own observation, the star rarely gaps intraday, so most versions are the relaxed variant. Read the level and the volume first, and let the third candle close.
Is Morning Star a good stock to buy?
That question is about Morningstar, the investment research firm, which is a company and unrelated to this pattern. This page gives no stock opinions.
Watch the open with Kev
Kev trades the open live on stream in the Momentum trading room and calls out his entry and his stop as he takes each trade, so you see the thought process behind every decision. Membership includes the live stream and its recordings, the Momentum Scanner, the Momentum Journal, and the nightly and pre-market watchlists. Start your 7-day free trial. Free for 7 days, then $197 a month. Cancel anytime.
This content is for educational purposes only and is not financial advice. Trading involves significant risk and may not be suitable for all traders.