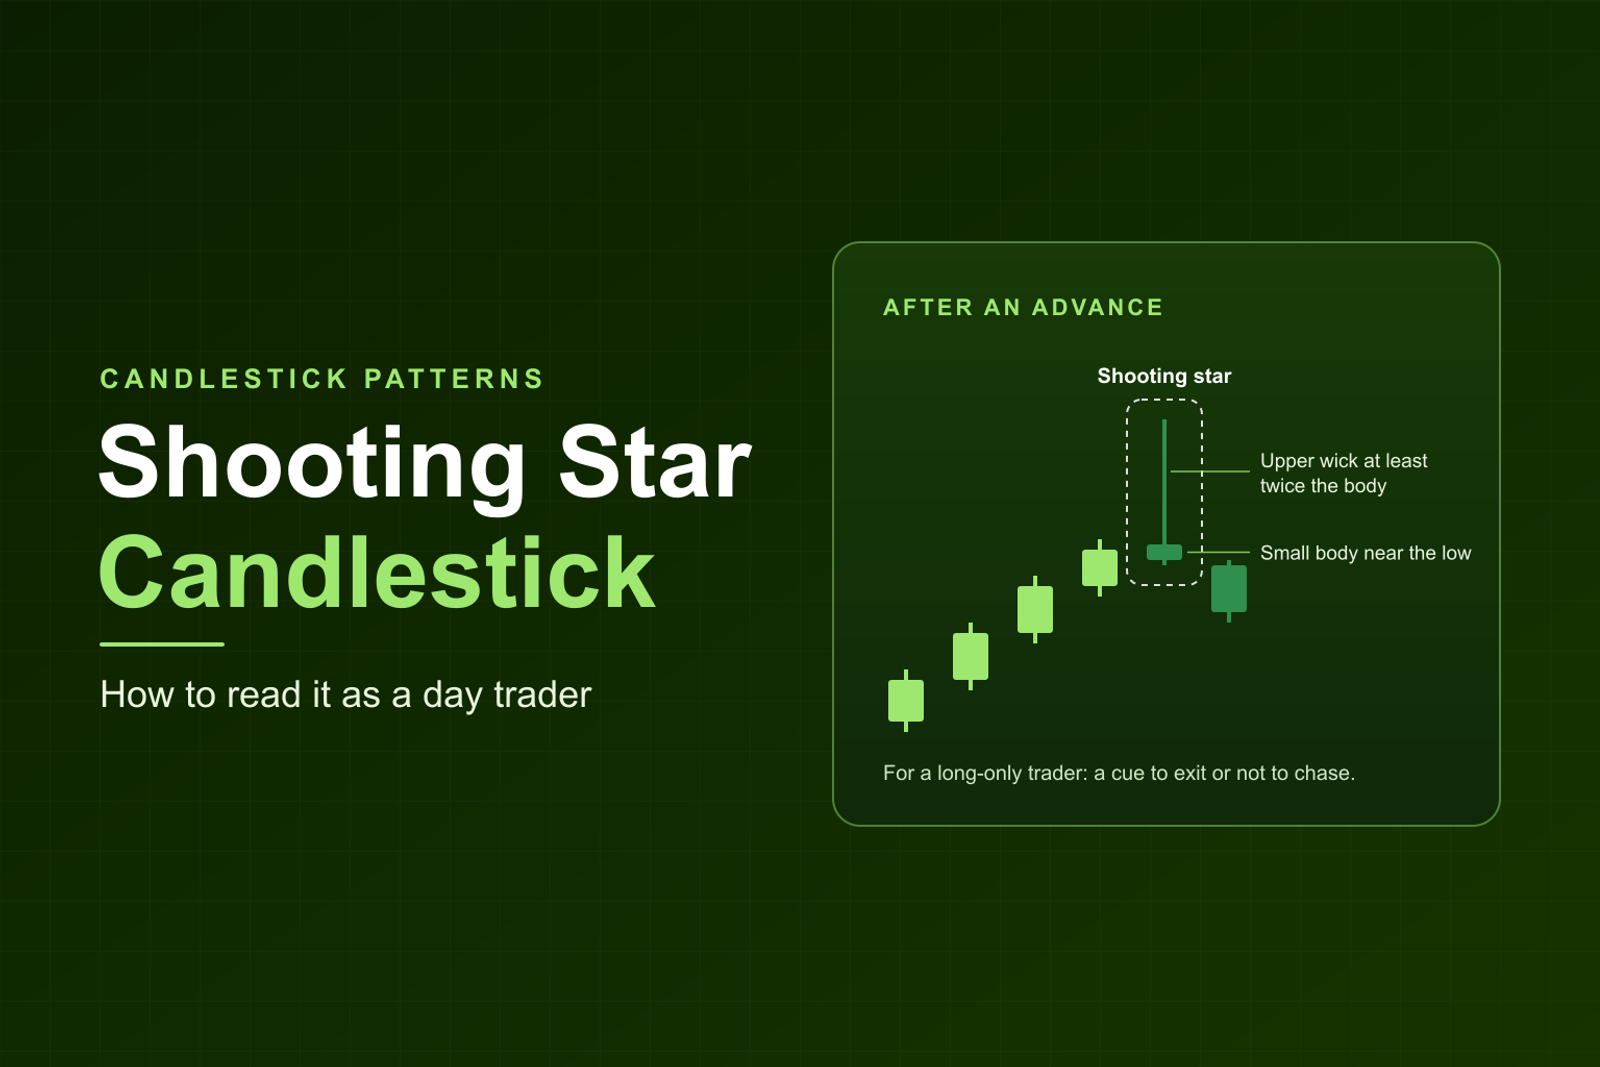
Short answer: A shooting star is a single candle that forms after a push higher: a small body near the bottom of its range, a long upper wick at least twice the body, and little or no lower wick. After a rally, buyers pushed higher and got rejected. It is a warning, and the next candle decides whether the rejection holds. On daily charts, the pattern researcher Thomas Bulkowski finds it a bearish reversal 59% of the time. That is not a day-trading win rate.
Kev (Kevin Cabana, who runs the Momentum trading room) trades long only, which means every trade he takes is a long, a trade that buys a stock expecting it to rise. So this page asks what a shooting star means for someone holding or planning a long. It goes deeper than our guide to reading candlestick charts. A wick is the thin line above or below the body that shows how far price traded beyond it. A stop is the price where you exit a trade that goes against you.
Is it a shooting star?
The first four rows decide whether a candle has the shape. The Where and Next candle rows are this page's day-trading additions: they decide whether the shape matters to a long.
What is a shooting star candlestick?
It is one candle with a particular shape. The sources below call a wick a shadow. Bulkowski, whose test results come up below, tells you to look for a "small bodied candle" with "a tall upper shadow at least twice the height of the body". Investopedia's checklist agrees on the floor: "an upper shadow that is at least twice the size of the body, and little or no lower shadow". It adds that "It comes after a strong uptrend" and "It occurs at or near a recent high".
The sources agree on a floor of at least twice the body, and this page uses that floor and no more. Bulkowski's three times rule belongs to a different, two-candle pattern, covered below.
The body has to be visible. Investopedia says "The candlestick body is very short but not nonexistent." Our doji page draws the line at a body no bigger than 5% of the candle's range. Past that line, on this page, the candle counts as a shooting star. At or under it, the same long upper wick is a gravestone doji.
IG describes the story: "buyers pushed price sharply higher during the session but sellers took control and closed the candle near the open, rejecting the advance."
How is a shooting star different from an inverted hammer, hanging man and gravestone doji?
All four have a small body, and three of them have a long upper wick. They differ in which side the wick is on, how big the body is, and what came before.
The inverted hammer and the shooting star are one shape with different histories. StockCharts says "The Inverted Hammer and Shooting Star look identical but have different implications based on previous price action." After a decline it is an inverted hammer. After a rally it is a shooting star. Our hammer candlestick page covers it in full.
Bulkowski's inverted hammer is a different pattern: "A hammer is a single candle line in a downtrend, but an inverted hammer is a two line candle, also in a downtrend." His result does not belong in the one-candle row, so the cell says no figure.
The hanging man is the other rally-side shape, with the long wick underneath. The gravestone doji has the same upper wick with no real body, and the doji page covers it.
Is a shooting star bullish or bearish?
Bearish, by the textbook. StockCharts: "The Shooting Star is a bearish reversal pattern that forms after an advance and in the star position, hence its name." Investopedia calls the signal stronger if "The closing price is below the opening price", but no source we read puts a number on that, so this page does not claim a red star is more reliable.
How bearish is a different question. Bulkowski tests it on daily charts and reports a bearish reversal 59% of the time. His own reading: "Examining the performance statistics confirms that the shooting star acts as a reversal 59% of the time." Then the caution: "Thus, although price reverses more often than not, do not depend on that happening."
Where does a shooting star matter for a day trader?
At a high, and at a level. In the middle of a flat range it tells you nothing. At a premarket high, at VWAP or at a failed push through resistance it is a rejection at a price traders are already watching.
The intraday candle Kev watches for is the topping tail. His 2026 strategy recap says: "A topping tail is a massive reversal indicator." His exit rule on a long he holds is: "price tries to break out and instantly rejects (topping tail) = full exit, every single time, no exceptions."
Our beginner guide, under Kev's byline, goes as far as this line: "The shooting star's intraday relative is the topping tail: a candle that tries to break out and instantly rejects, leaving a long upper wick." Reading his topping tail as a shooting star is this page's mapping. His reversal guide lists "a topping tail at the highs" among his warning signs.
The textbook waits for a confirming candle. Kev's rule on a long he holds does not: in his reversal guide, "The topping tail is the exception: for me it's an exit on its own." The textbook asks whether the top is in. His rule asks what to do about a stock you already own. Read the full rule in his 2026 strategy recap.
What does a long-only trader do with a shooting star?
Never a short. Nothing on this page teaches one. There are two cases.
- You hold a long. Exit, or tighten the stop. Kev's recap says "price tries to break out and instantly rejects (topping tail) = full exit". In his winners post, he writes "I trim into planned levels while the trade works, trail the rest, and sell everything that's left on a topping tail." That is his rule for his method, an example to adapt.
- You were going to buy there. Take no new long into it, and do not chase. Kev's chasing post says "After my first exit, the rejection high became supply." The rejection high is the top that sellers pushed price back down from, and supply means sellers waiting to sell at that price. His re-entry comes "only on a confirmed supply flip: break above the rejection high, pull back, retest, then take it again." Our chasing guide has the full version.
Confirmation on this page means the next candle closes below the shooting star's low. Investopedia: "Perhaps the most reliable is a strong bearish follow-through candle, ideally closing below the shooting star’s low." Failure is the mirror: the next candle closes back above the shooting star's high, and the rejection did not hold. That mirror rule is this page's convention, by symmetry with the hammer page. No source we read states it in those words.
IG says "Single-candle patterns signal sentiment shifts but should not be traded in isolation." Our position size guide gives the formula: "Position size is your dollar risk divided by your risk per share."
Momentum's 1-2-3 rule from the chatroom page: "risk no more than 1% of the account, never enter without 2:1, and stop for the day after 3 losses." A stop also does not guarantee a fill price: "A stop-loss limits your loss, but it doesn't guarantee the exact price you'll get."
A hypothetical worked example
Every number here is made up, on a made-up stock. This is a hypothetical with no forecast and no result, and it computes risk only.
A long is entered at $4.20 with the stop at $4.05, so the risk is $0.15 a share. On a $10,000 account, the 1-2-3 rule's 1% is $100 of risk. Size is $100 divided by $0.15, which is 666 shares after rounding down. The 2:1 floor puts the first target at $4.50, which is $4.20 plus two times $0.15.
Later a candle opens at $4.28, runs to $4.48, dips to $4.22 and closes at $4.24. The body is $0.04, the upper wick is $0.20 (five times the body), the lower wick is $0.02, and the range is $0.26. The body is about 15% of the range, above the doji page's 5% line, so the shape qualifies.
On the long you hold, this page's read is exit, or move the stop up under the candle's low at $4.22. At a level you have not bought, take no new long until price breaks above $4.48, pulls back and retests it.
Why is a 1-minute shooting star on a small cap mostly noise?
A 1-minute chart prints a lot of candles, so it prints more stray long wicks with no level under them. A small cap is the stock of a company with a small total market value.
On a thin, low-float stock (one with few shares available to trade), a 1-minute candle with a long upper wick is often a few prints at a high price and then trading back down. Few shares changed hands, so there was no real contest to read. Check the volume under the candle, and read the 5-minute chart first.
Our candlestick guide says "On intraday charts, lean harder on the level, the volume and a confirming candle." No source we found measures the shooting star on 1-minute or 5-minute charts, or on small caps, so this page has no intraday figure to give.
How reliable is a shooting star?
Near random on daily charts. Bulkowski's ThePatternSite is the only primary source we found that tests it, and what he tests is narrow. The percentages below count which way price first closed beyond the candle or pattern on daily charts in his database. The ranks are out of 103 candlestick patterns, and a rank of 1 is the best. The frequency rank shows how often the pattern appears, and the overall performance rank sums how far price moved 1, 3, 5 and 10 trading days after that first close.
His two shooting stars are different patterns. The one-candle version, the one this page teaches, more often reversed. The two-candle version, which needs an upper wick "at least three times the height of the body", more often went on up.
In his glossary a reversal is when "price enters and exits a chart pattern in opposite directions". A 59% reversal is nine points better than a coin flip. He calls the shooting star "near random" in his own quote marks, and on his example chart he writes "it does so only 59% of the time". On the size of the move he says "I consider moves of 6% or more to be good, so the shooting star falls well short."
Three limits apply. First, daily charts: "Day traders that I know depend on the shooting star more often than I think they should, but my statistics are based on the daily charts, not intra day ones." Second, his figures are "based on hundreds of perfect trades", and they say nothing about entries, stops, slippage (the gap between the price you expect and the price you get) or size. Third, none of these rates is a win rate. A win rate would need entries, stops, exits and costs, and no published test we found gives one for the shooting star on intraday small caps.
Two academic abstracts are the closest we found to an intraday or small-cap test. One academic test on intraday futures data found no evidence that candlestick patterns predicted price, alone or with other indicators such as momentum (Fock, Klein and Zwergel, Journal of Derivatives, 2005, by our paraphrase of the abstract). Marshall, Young and Rose wrote in a working paper abstract "We find that these strategies are not generally profitable when applied to large U.S. stocks."
When does a shooting star fail?
- A strong uptrend keeps going. Investopedia: "False signals are common in strong uptrends and low-volume markets, making it essential to assess the broader market."
- Volume is thin. "Conversely, low volume weakens the signal, increasing the chances of a failed setup." A wick on a few prints is the clearest case.
- The next candle closes above the high. That is the failure on this page: the rejection did not hold, and the high may be a level to watch.
- The exit leaves part of the move. Kev says it himself: "Yes, the rule sometimes leaves money on the table". And in the winners post: "That's the cost of a rule."
- There is no certainty. Investopedia: "Note that the existence of a shooting star candlestick doesn’t guarantee a reversal."
Shooting star candlestick: frequently asked questions
Is the shooting star candlestick bullish or bearish?
Bearish by the textbook. It forms after a rally, and the long upper wick shows buyers pushed higher and got rejected. On daily charts, Bulkowski finds a bearish reversal 59% of the time. The same shape after a decline is an inverted hammer. It is a warning for a long you hold, and the next candle decides.
What is the difference between a shooting star and an inverted hammer?
Only the trend before it. The shape is the same: a small body near the low and a long upper wick. After a rally it is a shooting star. After a decline it is an inverted hammer. Bulkowski's inverted hammer is a two-candle pattern, so this page gives it no figure.
Does a shooting star have to be red?
No. Investopedia calls the signal stronger if the close is below the open, but either color qualifies as long as the body is small and the wick is at least twice the body. No source we read puts a number on how much stronger a red one is, so this page does not claim one.
What does a shooting star mean for a long-only trader?
It is a warning on a long you hold: exit, or tighten the stop. At a level where you were going to buy, take no new long and do not chase. It is never a short entry on this page. Look again only after price breaks above its high, pulls back and retests it.
Does a shooting star work on 1-minute or 5-minute charts?
No published test we found measures it on those charts, so there is no intraday figure to give. A 1-minute chart prints far more long wicks with no level under them, often on thin volume. Read the 5-minute chart first and check the volume under the candle.
How reliable is a shooting star candlestick?
On the daily charts he tested, Thomas Bulkowski finds a bearish reversal 59% of the time and calls it near random. That counts which way price first closed beyond the candle. It says nothing about entries, stops, intraday charts, small caps or any trader's results, and it is not a win rate.
Watch the open with Kev
Kev trades the open live on stream in the Momentum trading room and calls out his entry and his stop as he takes each trade, so you see the thought process behind every decision. Membership includes the live stream and its recordings, the Momentum Scanner, the Momentum Journal, and the nightly and pre-market watchlists. Start your 7-day free trial. Free for 7 days, then $197 a month. Cancel anytime.
This content is for educational purposes only and is not financial advice. Trading involves significant risk and may not be suitable for all traders.