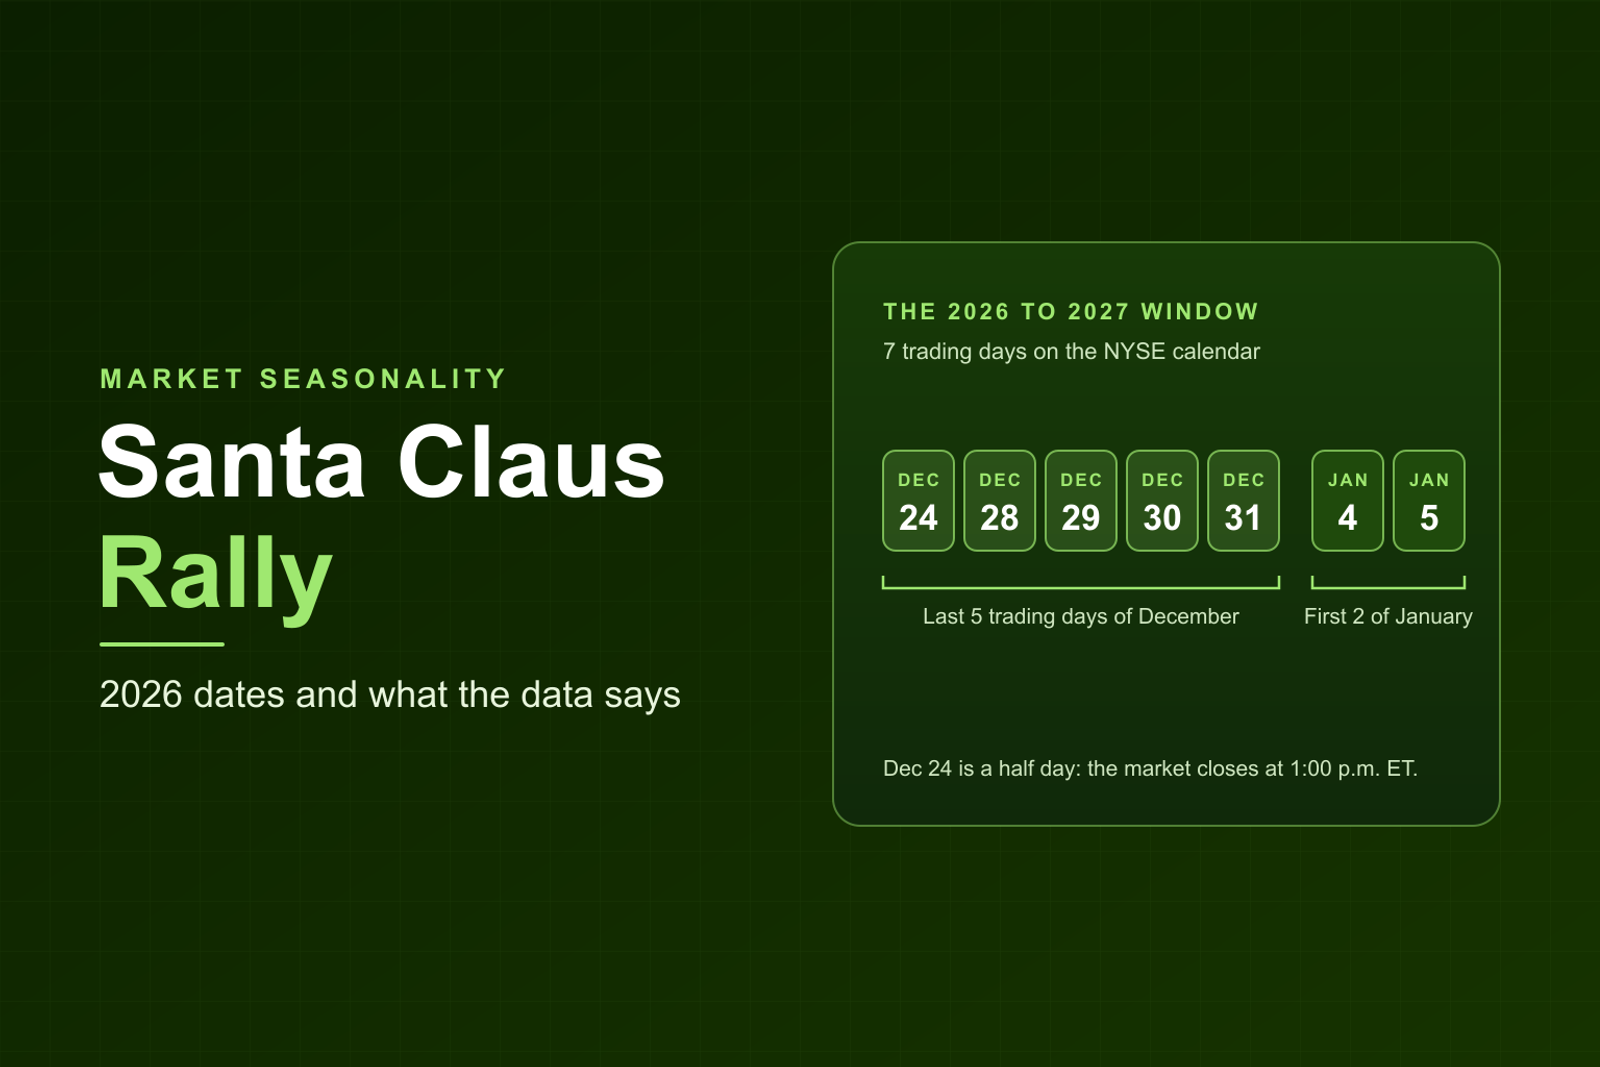
Short answer: The Santa Claus rally, or Santa rally, is the S&P 500's move over seven trading days: the last five of December and the first two of January. The Santa Claus rally 2026 window runs from Thursday, December 24, 2026 to Tuesday, January 5, 2027, measured from the December 23 close. In our calculation from S&P 500 daily closes, the 77 windows ending January 1950 to January 2026 averaged +1.25% and 59 of them finished up, but the last three finished down. A historical average is not a trade signal, and nothing on this page predicts the 2026 window.
Santa Claus rally dates for 2026 and 2027
A trading day is a day the stock market is open, so weekends and market holidays are skipped. An early close, or half day, is a session that ends at 1:00 p.m. ET.
2026 to 2027 window
2027 to 2028 window
Holidays and early closes are from the NYSE holiday calendar, read November 9, 2026; the day numbers are our count. Every closure and early close for both years is on our stock market holidays 2026 and 2027 page.
What is the Santa Claus rally?
The Stock Trader's Almanac, the annual book Yale Hirsch founded, defines it as "the propensity for the S&P 500 to rally the last five trading days of December and the first two of January". Yale Hirsch identified it in 1972 and published it in the 1973 Stock Trader's Almanac. His son, Jeffrey A. Hirsch, now edits the Almanac and posts the result each January with Christopher Mistal (the January 5, 2026 alert).
The window is a fixed count of seven sessions that can start before Christmas and always ends in January. Looser versions circulate: all of December, the last trading week of the year, or any year-end rally. Jeff Hirsch told Yahoo Finance in 2012 that "People use the phrase sort of loosely for any sort of year end rally".
What the data says
The Almanac's alerts give an average gain of 1.3% since 1950. Other sources differ a little because each picks its own start and end year, so we rebuilt the numbers from daily closes with the period stated.
S&P 500 Santa Claus rally windows by period (our calculation)
Method: our calculation from S&P 500 price index daily closes (the ^GSPC series from Yahoo Finance, downloaded November 9, 2026; the series has no Saturday sessions, so early windows count weekday sessions only), close before day 1 to close of day 7, dividends excluded, no trading costs. The hit rate is the share of windows that finished up.
- The quoted figures hold up. The second row rebuilds the 58 up windows out of 73 often quoted for 1950 to 2022 (windows starting December 1950 to December 2022), with its 1.3% average. That average covers all windows; the up windows alone averaged +2.10% (windows ending January 1950 to January 2026).
- The average has shrunk. It was +1.25% for windows ending January 1950 to January 2026, +0.80% for windows since 2001 and +0.48% for the last 10. Ten windows is a small sample.
- The base rate is lower. The base rate is what any seven sessions do: every rolling seven-session span of the S&P 500 since 1950 averaged +0.254% and finished up 58.0% of the time (19,335 spans, same data).
- The range is wide. Of the 77 windows ending January 1950 to January 2026, 6 lost 2% or more and 14 gained more than 3%. The best was +7.45% (December 2008 to January 2009) and the worst was minus 4.04%, the window that ended in January 2000.
The last 10 Santa Claus rally windows
Method: our calculation, same method as above. The S&P 500 closes match the SP500 series on FRED, from S&P Dow Jones Indices, to two decimals for all 10 windows. The Russell 2000 is an index of smaller US companies, often called small caps; its price index closes come from Yahoo Finance only. Data read November 9, 2026.
The S&P 500 finished up in 7 of the 10 and averaged +0.48%. After the window that ended January 5, 2026, the Almanac wrote that "Santa was a no-show for the third year in a row". Among windows ending January 1950 or later, these are the first three down windows in a row in our data; the windows ending January 1947, 1948 and 1949 were all down too.
Does "If Santa Claus should fail to call" work?
The Almanac's couplet reads: "If Santa Claus should fail to call, bears may come to Broad and Wall." Broad and Wall is the street corner of the New York Stock Exchange. Phrase historian Barry Popik records it in the Chicago (IL) Tribune of December 20, 1972.
The S&P 500's calendar year that each window ends in, years 1950 to 2025 (our calculation)
Method: the S&P 500 price change for the calendar year each window ends in, dividends excluded, same data as above.
The Almanac's own count agrees (SCR is its short form for the Santa Claus rally): "Of the 17 down SCRs since 1950, 12 years have been up and 5 down". In our data, the five down years were 1969 (minus 11.4%), 1994 (minus 1.5%), 2000 (minus 10.1%), 2008 (minus 38.5%) and 2015 (minus 0.7%). The Almanac points to two: "A 4.0% decline in 2000 foreshadowed the bursting of the tech bubble and a 2.5% loss in 2008 preceded the second worst bear market in history."
On the other side, five miss years finished up 20% or more: 1967, 1980, 1985, 1991 and 2024. A miss has come before a weaker average year, most miss years still ended up, and 17 cases is a small sample. The window that ended January 2026 is the 18th miss since 1950. Its year is not finished, and this page does not forecast it.
Why the Santa Claus rally might happen
Wikipedia's entry is blunt: "There is no generally accepted explanation for the phenomenon." The explanations offered are hypotheses:
- Thin holiday trading. "Lighter volume due to holiday vacations makes it easier to move the market higher" (Wikipedia).
- Mood, spending and bonuses. Investopedia lists "increased holiday shopping, seasonal optimism, end-of-tax-year considerations, and less institutional trading", and says some point to year-end bonuses.
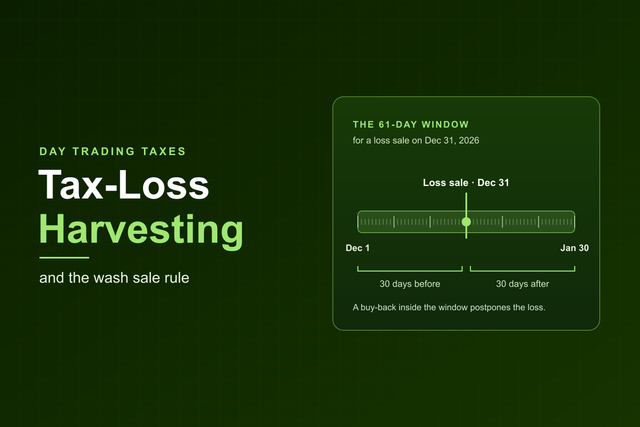
- Tax-loss selling ending. "A slow down in tax-loss harvesting that depresses prices at the beginning of December" (Wikipedia). The wash sale rules behind year-end selling are in our guide to tax-loss harvesting for day traders.
The first one cuts both ways for a trader. Thin trading that can lift an index average can also widen spreads on small stocks. The spread is the gap between the highest price a buyer will pay and the lowest a seller will accept.
Small caps and the January effect
The January effect is the claimed tendency of stocks, small caps above all, to do better in January. It is a separate idea from the Santa window. The academic work starts with Rozeff and Kinney, "Capital market seasonality: The case of stock returns" (Journal of Financial Economics, 1976), and Keim, "Size-related anomalies and stock return seasonality: Further empirical evidence" (same journal, 1983). Investopedia summarizes them as pointing to tax-loss selling in December and reinvestment in January, with Keim adding window dressing (fund managers tidying their holdings for year-end reports) and tax strategies, "particularly for small cap stocks."
The evidence is mixed. A paper by Gu, quoted on Quantpedia, found "a pronounced declining trend for both large and small firm stock indices since 1988". The same page prints the abstract of a paper by Easterday, Sen and Stephan, "The Persistence of the Small Firm/January Effect", which reports that January returns were smaller after the 1963 to 1979 period but "have simply reverted to levels that existed before that time."
In a November 2022 post about December, Jeff Hirsch writes that small caps "tend to start to outperform larger caps near the middle of the month", meaning December. We checked the Russell 2000 against the S&P 500 over the Santa window and over January. Both start later than mid-December, so the rows below test only part of his claim.
Russell 2000 vs S&P 500 (our calculation)
Method: price indices for the Russell 2000 and S&P 500 from Yahoo Finance (the ^RUT and ^GSPC series, read November 9, 2026), same window method, dividends and costs excluded. Differences are in percentage points. The Russell 2000 has no second source here.
A small-cap edge inside the window shows up only in the early years: the Russell 2000's lead falls from +0.49 points for windows since 1988 to +0.12 points once windows before 1997 are left out, and turns negative since 2011. January has been close to a coin flip. The Russell 2000 is also a different universe from the low-float stocks (those with few shares available to trade) that a momentum day trader trades, so neither result says anything about those stocks.
The January Barometer is a third idea, summed up in the Almanac as "as the S&P 500 goes in January, so goes the year". In our calculation for 1950 to 2025, 41 of the 46 years with an up January finished up, but so did 15 of the 30 years with a down January.
How a day trader can read the Santa Claus rally
The lines quoted here from Kev (Kevin Cabana, who runs the Momentum trading room) come from his guides and trade recaps. None of them is about the Santa window.
An index average is a different thing from a setup. The window is an S&P 500 figure measured close to close over seven sessions. In the last 10 windows it averaged +0.48% for all seven sessions together, smaller than an ordinary day's move: the average size of a one-day S&P 500 move, up or down, from 2016 to 2025 was 0.73% in our calculation. The index's seven-day drift says nothing about one small-cap stock on one morning.
Holiday liquidity is thin. Russell Investments wrote in 2021 that global equity markets tend to trade at 45 to 70% of normal volumes starting December 23, and typically return to normal two to five days after New Year's Day. Its note adds: "Lower volumes tend to widen spreads". Kev on the bid-ask spread: "For the small-caps I trade, the spread is something I respect, because on a thin stock it can be wide enough to hurt."
The half day is short. Day 1 of the 2026 window ends at 1:00 p.m. ET, a short session in a thin week. On the same spread page, Kev writes: "I lean on limit orders to control what I pay." In the SEC's Investor.gov definition, "A limit order is an order to buy or sell a security at a specific price or better." Trading halts can happen in any session, and a thin half day does not remove that risk. Kev on halted stocks: "If I cannot name my risk, I do not touch it."
Volume is the filter. Kev on relative volume: "Volume is what makes a move go, so a great-looking pattern on a stock nobody is trading usually goes nowhere." A holiday session can lift an index average and still leave a scanner with few stocks trading at high relative volume.
The risk rules stay the same. The 1-2-3 rule taught in the Momentum room is to "risk no more than 1% of your account on one trade, never enter without a 2:1 reward to risk, and stop trading for the day after 3 losses." A good or bad Santa window changes none of it. Kev's line from a slow, choppy session fits a thin week: "Trade a choppy market smaller and pickier."
Frequently asked questions
When is the Santa Claus rally in 2026?
From Thursday, December 24, 2026 to Tuesday, January 5, 2027: the last five trading days of December and the first two of January, measured on the S&P 500 from the December 23 close. December 24 is a half day, and the market is closed on December 25 and January 1.
How much does the Santa Claus rally average?
In our calculation from S&P 500 daily closes (Yahoo Finance data read November 9, 2026, price only, dividends excluded), the 77 windows ending January 1950 to January 2026 averaged +1.25%, and 18 of them finished down. The last 10 averaged +0.48%. Any seven-session span since 1950 averaged +0.254%.
Was there a Santa Claus rally in 2025?
Not on the S&P 500. The window from the December 23, 2024 close to January 3, 2025 fell 0.53%, and the window that ended January 5, 2026 fell 0.11%, the third miss in a row.
Is the Santa Claus rally the same as the January effect?
No. The Santa Claus rally is a fixed seven-session window measured on the S&P 500. The January effect is the claimed tendency of stocks, small caps above all, to do better in January. In our Russell 2000 calculation, the small-cap edge inside the window faded after the mid-1990s.
Can day traders trade the Santa Claus rally?
Not as a setup. The window is an index average over seven sessions, and it says nothing about any one stock on any one morning. Its sessions are thin, the 2026 window opens on a half day, and spreads on small stocks can widen. The usual risk rules apply unchanged.
Watch Kev trade live
In the Momentum day trading room, Kev trades live on stream and calls out his entry and stop as he takes each trade. Membership includes the live stream and its recordings, the Momentum Scanner and the Momentum Journal. Start your 7-day free trial. Free for 7 days, then $197 a month. Cancel anytime.
This content is for educational purposes only and is not financial advice. Trading involves significant risk and may not be suitable for all traders.