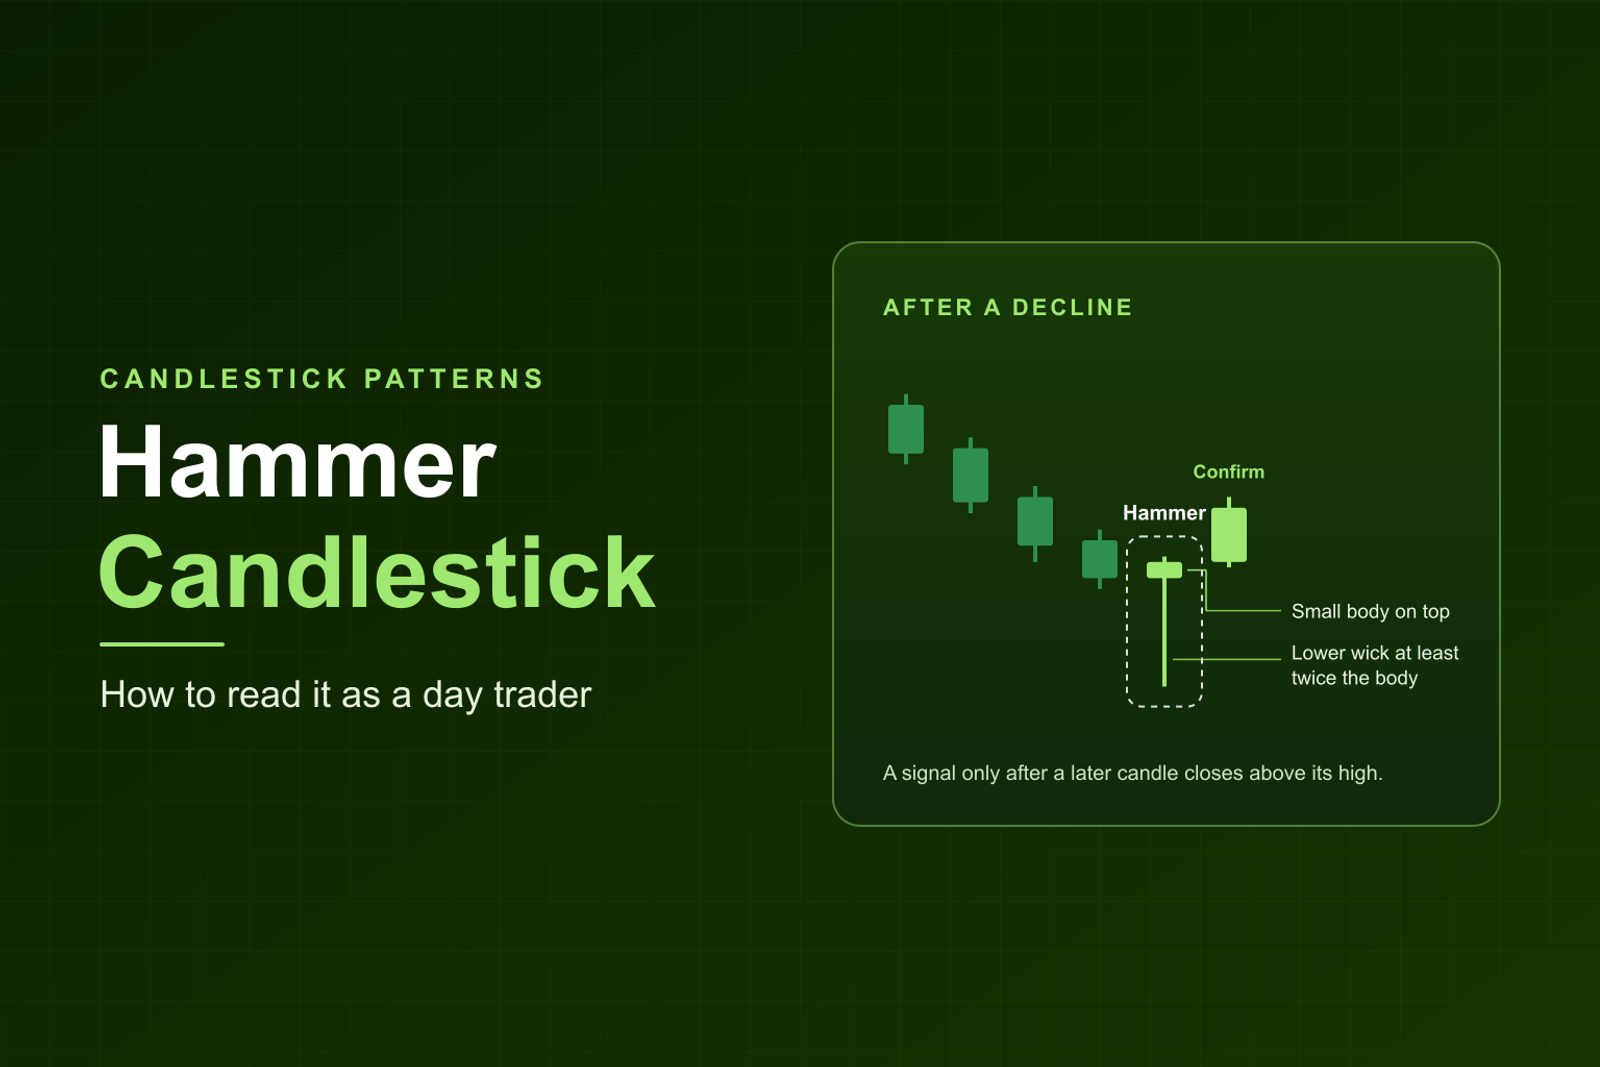
Short answer: A hammer is a single candle with a small real body in the upper part of its range, a lower wick at least twice the body (three times or more is the cleaner read), little or no upper wick, after a decline into the candle. It means far more at a support level than in open space. A hammer at a level is a candidate for a long (a trade that buys the stock expecting it to rise), and confirmation is a separate step that comes after: a later candle closes above its high.
Kev (Kevin Cabana, who runs the Momentum trading room) trades long only, which means every trade he takes is a long, so this page reads the hammer the way a long-only day trader has to. It goes deeper on one pattern than our guide to reading candlestick charts, and the two use the same core definition and the same Bulkowski numbers. A stop is the price where you exit a trade that goes against you.
Is it a hammer?
The first four rows decide whether a candle is a hammer. The Level row decides whether it is a candidate for a long, and the Confirmation row decides whether that candidate is confirmed. The Level row is this page's day-trading addition. The other rows come from StockCharts, Investopedia, IG and Bulkowski.
What is a hammer candlestick?
A hammer is a single candle with a small real body in the upper part of its range, a lower wick at least twice the body (three times or more is the cleaner read), little or no upper wick, after a decline into the candle.
The real body is the part of the candle between the open and the close. A wick, which many charting sources call a shadow, is the thin line above or below the body that shows how far price traded beyond it. Sellers pushed price down, and buyers took it back by the close. Investopedia puts it as "buyers stepped in to reverse the decline, pushing the closing price up to near the opening price."
Candlestick charts come from Japan's rice markets, and the credit usually goes to a rice trader named Homma. Steve Nison brought them to Western traders with his 1991 book, Japanese Candlestick Charting Techniques.
How do you spot a real hammer?
Start with the wick. StockCharts, Investopedia and IG set twice the body as the minimum, Bulkowski asks for two or three times, and Investopedia says that on the most bullish hammers the wick can run "three to five times longer." This page keeps twice the body as the minimum and treats three times or more as the cleaner read. StockCharts, Investopedia, IG and Bulkowski set no numeric limit for the body or the upper wick.
The decline matters as much as the shape. StockCharts, citing Greg Morris, says "for a pattern to qualify as a reversal pattern, there should be a prior trend to reverse." IG is blunter: "A hammer in an uptrend is largely meaningless." StockCharts suggests looking at the last 1 to 4 weeks of price action, a window written for daily candles. For a day trader, this page's adaptation is the session's own move into the candle.
Color is a tiebreak. Investopedia calls a hammer that closes above its open "an even stronger bullish signal." A red hammer opened higher than it closed and still finished well off its low, so it still counts.
What does a hammer mean?
A hammer is evidence that buyers defended a price during one candle. On its own it gives no signal. StockCharts: "While this may seem like enough to act on, hammers require further bullish confirmation."
Kev's price action guide says "One candle is a data point. Three or four in a row tell you whether a move is building or stalling."
Where does a hammer matter for a day trader?
At a level. Investopedia: "Hammers are most reliable after a significant downtrend, especially if they occur at an area of established support, whether via previous price action or major moving averages." Our support and resistance guide defines the term: "Support is a price level where buying gets strong enough to stop a stock from falling further." A hammer at support is a wick that tested the floor and was rejected.
The candlestick guide lists the intraday levels: "Is it at a level? Prior high of day, premarket high, VWAP, a key moving average, a round number." Our VWAP guide says "A reclaim that slips back under VWAP tells you the idea was wrong, so know where that level is before you get in."
A hammer in open space is just a candle. Kev's pattern roundup says "A hammer or engulfing candle earns attention only at a level on a stock in play."
Kev's 2026 strategy recap names a trigger that looks like a hammer: "a wick off the low as buyers step back in at the 9 EMA, 90 MA, or VWAP" (two moving averages and VWAP). Its rule is "No wick, no entry." He does not call it a hammer. The candlestick guide says "An intraday relative of the hammer is the wick off the low", and mapping his trigger onto the hammer is this page's own reading, which Kev has not described as a hammer rule.
How is a hammer different from a hanging man, inverted hammer, shooting star and doji?
The hammer and the hanging man are the same shape in a different place. Investopedia: "The hanging man and the hammer candlesticks look identical. The only difference is the context." The inverted hammer and the shooting star are one shape turned upside down, with a small body near the bottom of the range and a long upper wick. A doji is a candle whose open and close are nearly equal.
The inverted hammer is a single candle on StockCharts, Investopedia and IG, and on this page. Bulkowski's version has two candles and finds that it more often continues down, so his result does not belong in that cell.
For a long-only trader, the hanging man and the shooting star are warnings to manage a long, and nothing on this page teaches a short. Investopedia calls the hanging man "just a warning." Bulkowski's tests found the hanging man's textbook warning failed more often than it worked on daily charts.
Kev's 2026 strategy recap gives the exit for a rejection at the high: "price tries to break out and instantly rejects (topping tail) = full exit, every single time, no exceptions." Reading his topping tail as a shooting star is this page's mapping.
The dragonfly doji is the hammer's zero-body limit, with open, high and close at one price and a long lower wick. Bulkowski finds it "neither a reversal nor a continuation candle."
How does a long-only trader read a hammer?
- Find the level. A hammer at support, VWAP or a premarket high is a candidate. A hammer in open space is not.
- Wait for confirmation. Investopedia: "Good traders wait for confirmation, most often in the form of a bullish candle that shortly follows the hammer and closes above the high of the hammer." IG asks only for the next candle to close higher. This page uses Investopedia's bar, a close above the hammer's high, because it is also the event Bulkowski counts. On a daily chart StockCharts allows 1 to 3 days. On a 5-minute chart, the next candle or two is this page's adaptation.
- Put the stop under the low. Investopedia: "The most common approach is to place the stop-loss order just under the hammer's low."
- Size from the stop. Momentum's 1-2-3 rule from the chatroom page: "risk no more than 1% of the account, never enter without 2:1, and stop for the day after 3 losses." A 2:1 reward to risk means the distance from entry to target is at least twice the distance from entry to stop. Our position size guide defines it: "Reward to risk is the target minus the entry, divided by the entry minus the stop." It also gives the sizing formula: "Position size is your dollar risk divided by your risk per share."
- Know the cost of waiting. Investopedia's hanging man page says "waiting for confirmation can result in a poor entry point" for that pattern and many others.
A hypothetical worked example
Every number here is made up, on a made-up small cap on the 5-minute chart. This is hypothetical and not a trade, with no forecast and no result. It computes risk only, with an account of $20,000, so 1% risk is 0.01 x $20,000 = $200. Each hammer prints at VWAP after a pullback, so each passes the Level row.
Hammer A has a long wick: open $4.30, high $4.40, low $4.00, close $4.40. The body is $0.10 and the lower wick is $0.30, which is 3.0 times the body, with no upper wick. The next candle closes at $4.45, above the $4.40 high. Hammer B has a shorter wick and is still valid: open $4.35, high $4.40, low $4.25, close $4.40. The body is $0.05 and the lower wick is $0.10, which is 2.0 times the body. It gets the same $4.45 confirmation close.
A's risk per share is $0.46 / $0.21 = 2.19 times B's, so the same 1% buys 434 shares instead of 952. Kev's recap describes "Tight, defined, 20-cents-a-share style risk." Hammer B's $0.21 sits near that and hammer A's $0.46 is more than double it. That comparison is this page's own.
The wider the stop, the more room price needs before the 2:1 reward-to-risk rule allows the trade. That is a reason to skip a valid hammer intraday: a long wick can put the stop so far away that the trade cannot meet 2:1.
The cost of waiting. Entering at hammer A's own $4.40 close would risk $4.40 - $3.99 = $0.41 per share, or 487 shares. Waiting for the close above the high adds $0.05 of risk per share and cuts 53 shares. In exchange you get evidence that buyers held the candle.
The slippage check. Our stop-loss guide says "A stop-loss limits your loss, but it doesn't guarantee the exact price you'll get." If hammer A's $3.99 stop filled at $3.94, the loss would be ($4.45 - $3.94) x 434 = $221.34, or 1.11% of the account, over the 1% plan.
Why is a hammer on a 1-minute chart mostly noise?
Because a 1-minute chart prints a lot of candles. A regular US session runs from 9:30 a.m. to 4:00 p.m. ET, which is 390 minutes, so 390 one-minute candles and 78 five-minute candles. From 9:30 to 11:00 a.m. alone that is 90 one-minute candles and 18 five-minute candles. More candles means more hammer-shaped candles with no level under them. On a thin, low-float stock (one with few shares available to trade), a single print can draw a long lower wick, so a hammer there means little without volume on the candle.
The candlestick guide states the trade-off: "a 1-minute chart prints hundreds of candles a day." Our timeframes guide says "The 1-minute chart should never be your main decision-maker." The candlestick guide also notes "The published reliability data is from daily charts. On intraday charts, lean harder on the level, the volume and a confirming candle."
What happens to a hammer around a halt?
Read nothing into a hammer that spans a halt. A trading halt is a pause, and Investor.gov says "Securities exchanges, not the SEC, determine whether to impose a trading halt or delay in a stock." One mechanism is the Limit Up Limit Down (LULD) plan, which sets price bands above and below a stock's average price over the preceding five minutes. A Limit State starts when the best bid or offer reaches a band without crossing it, and the plan's rule is: "If the market does not exit a Limit State within 15 seconds, the primary listing exchange declares a five-minute Trading Pause."
A candle that spans a pause and a gapped reopen can draw a long wick that no trader could have traded through, so do not read it as a hammer. Our halted stock guide says "You cannot trade a stock while it is halted." A stop cannot fill during the pause and can fill far past its price at the reopen. Kev's rule in that guide: "I never buy blind into the resume."
How reliable is the hammer?
Only one primary source we found gives tested hammer figures. Bulkowski's ThePatternSite reports "Tested performance: Bullish reversal 60% of the time" for the hammer, based on "hundreds of perfect trades." His glossary defines a reversal as "When price enters and exits a chart pattern in opposite directions." In plain terms, his glossary counts a breakout as price moving above the top or below the bottom of the candle, and a hammer is a reversal when the breakout is upward, which he found 60% of the time.
Three limits apply. His hammer example is a daily chart, and on his shooting star page he writes that "my statistics are based on the daily charts, not intra day ones." He calls his measurement basis "perfect trades", and his figures say nothing about entries, stops, slippage or size. And his reversal rank for the hammer is 26 out of 103 candlestick patterns, while his overall performance rank, which ranks the percentage price change 1, 3, 5 and 10 trading days after the breakout, is 65 out of 103, where 1 is best. Of the 60%, he writes: "That's not bad, but it's also not far from random (50%)."
Bulkowski's 60% counts reversals on daily charts in his sample. A win rate would need entries, stops, exits and costs, and no published test we found gives one for hammers on intraday small caps.
Two academic studies, read from their abstracts, found little support for candlesticks in general. Fock, Klein and Zwergel tested candlestick patterns on intraday futures data from the DAX stock index future and the Bund interest rate future (Journal of Derivatives, 2005). By our paraphrase of the abstract, they found no evidence that the patterns predicted price, alone or with other common indicators such as momentum. Marshall, Young and Rose wrote in a 2007 working paper abstract "We find that these strategies are not generally profitable when applied to large U.S. stocks." Neither abstract reports a result for the hammer on its own. Our candlestick guide covers a third, a 2015 study in which Lu, Chen and Hsu tested candlestick reversal patterns on Dow Jones stocks, and there the verdict flipped on how the trade was held and exited.
Frequently asked questions
Is a hammer candlestick bullish?
After a decline it is a bullish reversal pattern, and at a level it is a candidate for a long. Confirmation comes after, as a separate step: a later candle closes above its high, which is the confirmation this page uses. StockCharts: "Only preceding price action and further confirmation determine the bullish or bearish nature of these candlesticks." A hammer is a single candle with a small real body in the upper part of its range, a lower wick at least twice the body (three times or more is the cleaner read), little or no upper wick, after a decline into the candle.
Is a red hammer bullish or bearish?
Still bullish after a decline, slightly weaker than a green one. A red hammer closed below its open, well off its low. Investopedia reads that as "residual selling pressure."
What is the difference between a hammer and a hanging man?
Context. They look identical, and the hammer follows a decline while the hanging man follows a rally. For a long-only trader the hanging man means add nothing and tighten the stop on a long you hold.
Do hammers work on 1-minute or 5-minute charts?
No published test we found measures hammers on intraday small caps, so there is no intraday figure to give. The shape reads the same on either chart, but a 1-minute chart prints hundreds of candles a day, so far more hammer shapes print there with no level under them. As the candlestick guide puts it, "On intraday charts, lean harder on the level, the volume and a confirming candle."
How reliable is a hammer candlestick?
Bulkowski finds a bullish reversal 60% of the time on daily charts in his sample. That counts upward breakouts above the candle, and it says nothing about intraday small caps or about any trader's results.
Where do you put the stop on a hammer?
Under the hammer's low, the textbook invalidation. On a long-wick hammer that stop can sit far from the entry, so size from it, risking no more than 1% of the account, and skip the trade if it cannot meet the 2:1 reward-to-risk rule.
Watch the open with Kev
Kev trades the open live on stream in the Momentum trading room and calls out his entry and his stop as he takes each trade, so you get the reasoning behind every trade. Membership includes the live stream and its recordings, the Momentum Scanner, the Momentum Journal, and the nightly and pre-market watchlists. Start your 7-day free trial. Free for 7 days, then $197 a month. Cancel anytime.
This content is for educational purposes only and is not financial advice. Trading involves significant risk and may not be suitable for all traders.