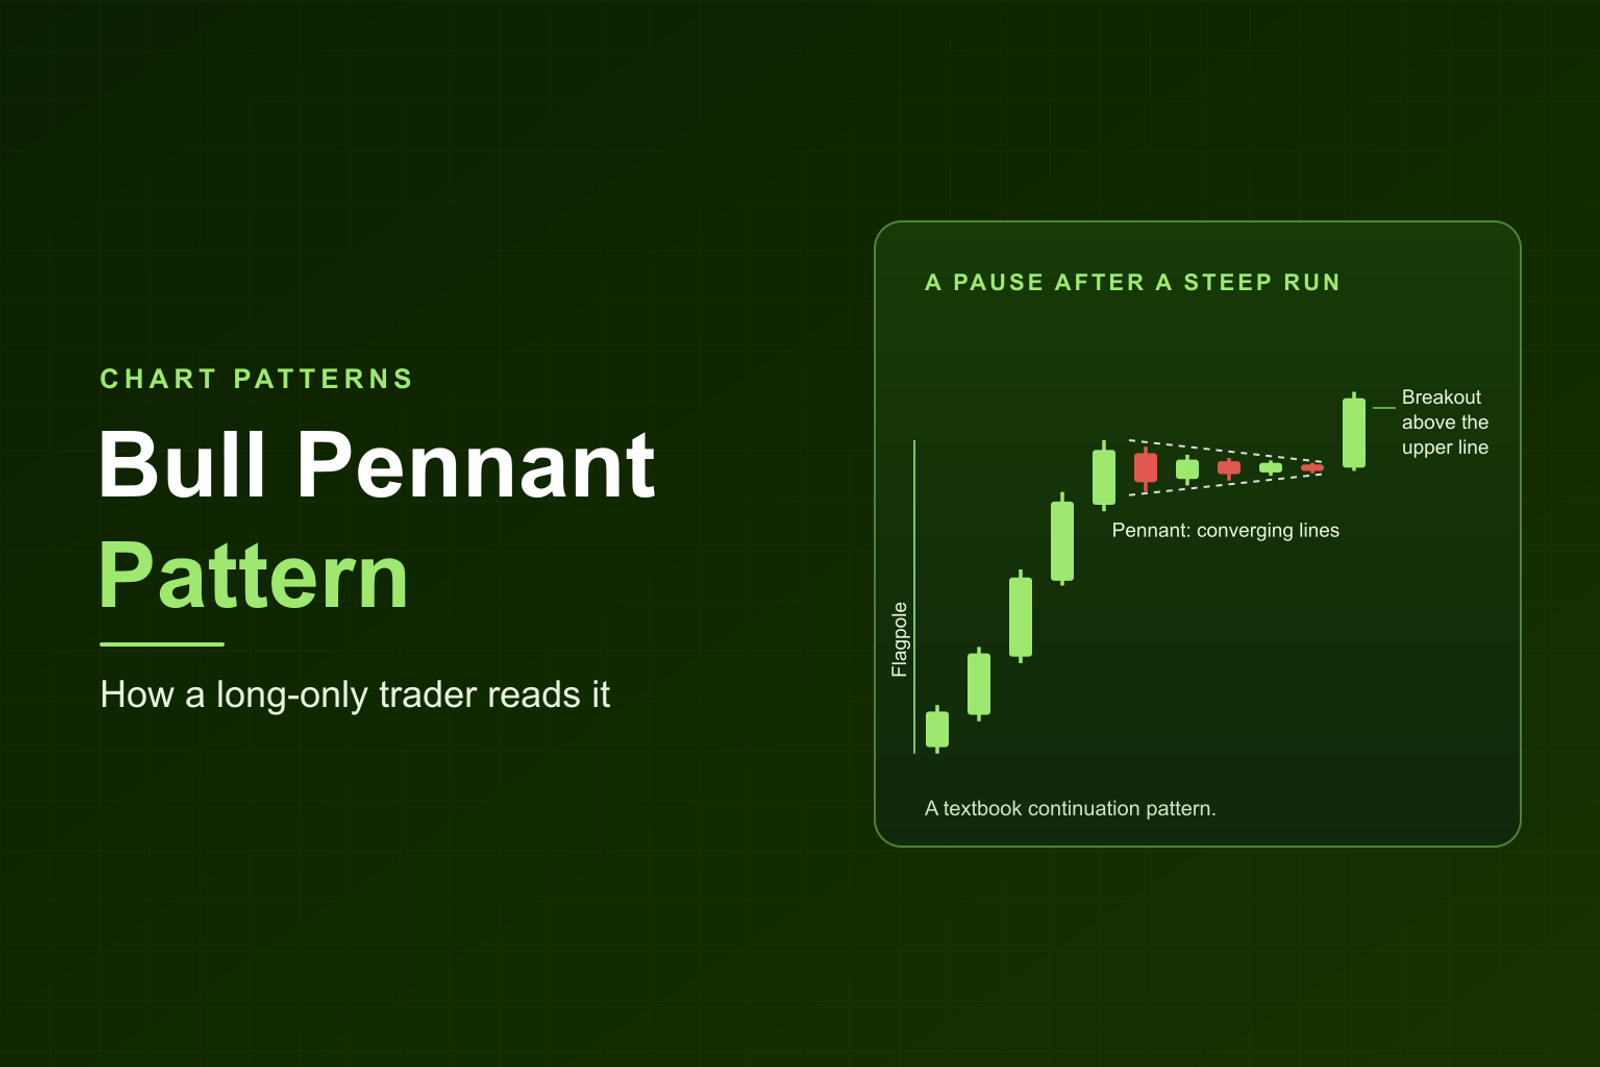
Short answer: A bull pennant is a continuation pattern (a pause after which price tends to resume its earlier direction): a steep run up (the flagpole), then a small symmetrical triangle of converging lines on fading volume, then a close above the upper line. That close is the event that matters, because the shape alone leaves the direction open. In Bulkowski's sample, last updated on 27 Aug 2020, pennants after any trend broke upward 57% of the time, a count of break direction that says nothing about profit. Treat the pennant as a pattern to recognize and test, with the outcome open until price closes.
Is it a bull pennant? Checklist
Before you label a chart, check each row. A row you cannot tick means the label does not fit yet.
What is a bull pennant pattern?
A bull pennant is a short pause after a sharp move up. StockCharts' ChartSchool groups it with the flag: "Flags and Pennants are short-term continuation patterns that mark a small consolidation before the previous move resumes." It describes the pennant itself as "A pennant is a small symmetrical triangle that begins wide and converges as the pattern matures (like a cone). The slope is usually neutral."
The "bull" in the name comes from the direction of the pole. Investopedia puts it this way: "Bullish pennant patterns occur after an uptrend and indicate a potential continuation of the upward movement."
"Continuation" is what the textbooks expect, and each chart can still go either way.
How to spot a bull pennant: the three parts
The flagpole
The pole is the move that makes the pause worth watching. ChartSchool says flags and pennants "require evidence of a sharp advance or decline in heavy volume." Bulkowski writes that "The flagpole which leads to the pennant should be unusually steep and last several days."
The pennant
The pennant is the small triangle after the pole. Price moves between two converging trendlines, and Bulkowski says it "Looks like a short symmetrical triangle".
Volume tells you whether the pause is healthy. Investopedia says "The initial move must be met with large volume, while the pennant should have weakening volume, followed by a large increase in volume during the breakout." In Bulkowski's data, the volume trend inside the pennant was downward 86% of the time. That figure is a volume trend. How often the pennant worked is a separate measure, covered below.
The breakout
The breakout is the part you can act on, and it is the part the shape cannot promise. ChartSchool: "For a bullish flag or pennant, a break above resistance signals that the previous advance has resumed." Until price closes above the upper line, you have a pause that is still waiting for its signal.
How long does a bull pennant last?
No source gives one answer, so here is each range with the person or site that gave it.
The longest cap (12 weeks) is four times the shortest (3 weeks), so the sources do not draw the same line. Bulkowski, Investopedia and Capital.com stop at 3 weeks, while StockCharts allows up to 12 and says "A pennant more than 12 weeks old would turn into a symmetrical triangle."
On a morning chart of a small-cap stock (a company with a small market value) the same shapes compress. Our morning trend continuations guide says: "On a small-cap in its first two hours, the same shapes form in minutes, so treat these as adaptations of the textbook definitions."
Bull pennant vs bull flag
The difference is the shape of the lines. Investopedia: "Pennants have trendlines that converge and form a symmetrical triangle, while flags have parallel trendlines that create a rectangular shape." ChartSchool describes the flag as "a small rectangle pattern that slopes against the previous trend."
Both follow a sharp move and both pause. Our bull flag guide says the same in its quick comparison: "Pennant: tightening range (triangle-like compression)" and "All are continuation patterns."
Slope is where sources split. ChartSchool says a pennant's slope is usually neutral. Bulkowski adds a caution: "Performance suffers when the pennant slopes in the direction of the prevailing price trend."
Bull pennant vs symmetrical triangle, ascending triangle and wedges
Several shapes share a converging look. What separates them is the pole, the length and the slope of each line.
The line between a pennant and a symmetrical triangle is a convention that varies by source. The Two Traders puts it as "it follows a clear pole and resolves quickly, while a triangle can form anywhere and take far longer." The 60% for symmetrical triangles and the 57% for pennants come from different patterns, so keep them apart.
Is a pennant always bullish?
No. The pole sets the direction. A pennant after an advance is the bull version, and Bulkowski's identification table says the trend before it "Can be any direction leading to the chart pattern." The mirror shape after a decline is called a bear pennant, and this page does not cover it.
For the bull version, the textbook expectation is that price resumes up. Bulkowski's identification table gives the breakout as "Upward 57% of the time," and it covers pennants after any trend, so it spans bull and bear trends alike. About four in ten did not break upward (100 minus 57 is 43, a figure he does not print himself). A close above the upper line is the evidence, and a pause without that close is only a pause.
What does Bulkowski's data say about pennants?
Thomas Bulkowski publishes his chart pattern results on ThePatternSite. His pennant page is headed "Statistics updated on 8/27/2020" and cites his Encyclopedia of Chart Patterns, Second Edition. Every number below is his, from his own sample, from that page, which we read on 18 Nov 2026.
His page prints upward and downward breakout results side by side. These are the upward-breakout figures, from his table "Pennants: Important Bull Market Results":
Read these with four caveats.
- They are bull-market figures. His glossary counts everything outside the 2000 to 2002 and 2007 to 2009 bear markets as bull market, so the sample leaves out those two stretches.
- 54% is a failure rate. Bulkowski's glossary defines the break even failure rate as "A measure of the number of patterns that fail to rise (upward breakout) or decline (downward breakout) by at least 5%." In plain words, it counts patterns that did not move 5% in his swing measure. A pattern counted here can still have gained a little, so the figure measures swings that fell short of 5%, and winning trades are a different count.
- The measure is a short-term swing. His footnote says the pennant results use the short-term price swing, which is a different yardstick from the one he uses for most other chart patterns.
- The timeframe is unstated. The page does not say whether the charts are daily or intraday, and it leaves "perfect trades" undefined, so read the figures as swing measures from his sample, with real trades expected to differ.
His page also says that pennants "perform an invaluable service by marking the midway point in a move," but "they only work in this manner about 30% of the time". That 30% is how often the trend after the pennant was as long as the trend before it. Every figure here belongs to Bulkowski's sample.
In the sources we read, no pennant-specific academic study turned up, so the statistics on this page come from one practitioner's sample.
How to confirm a bull pennant breakout
Confirmation has two parts: where price closes, and what volume does.
A close above the upper line. The chart tool ChartGuessr puts it plainly: "The breakout that counts is a close above the upper line, made before the apex". A wick (the thin line above or below a candle's body, where price traded without closing) that pokes through the line and closes back inside is only a wick. The apex is the point where the two lines would meet. Once they do, ChartGuessr adds, "there is nothing left to break."
Volume on the break. ChartSchool says "An expansion of volume on the resistance (support) break lends credence to the validity of the formation and the likelihood of continuation."
Do not buy early. Investopedia calls this out: "A common mistake is entering the market too early." Our breakout trading guide makes a related point about consolidations in general: "Loose, choppy consolidation often breaks and fails." Bulkowski reaches the same place in his trading tips: "A tight pennant performs better than a loose one."
How to think about the measured-move target
The textbook target uses the height of the pole. ChartSchool: "The flagpole length can be applied to the resistance break or support break of the flag/pennant to estimate the advance or decline." The Two Traders describes it as a widely used rule of thumb: "The textbook target takes the height of the pole and projects it from the breakout point."
Bulkowski scales the same idea down. His rule says to take the pole height, "multiply it by the above 'percentage meeting price target,'" and "Add it (upward breakouts) to the bottom of the pennant". Because 35% of upward breakouts in his sample reached the pole-based target, his scaled target is a little over a third of the pole.
Can you read a bull pennant on a small-cap morning chart?
Kev (Kevin Cabana, who runs the Momentum trading room) trades small-cap momentum stocks, long only. The pennant sits among the textbook patterns in his morning trend continuations guide, where he says:
"The pennant and the ascending triangle are textbook continuation patterns I'm including so you recognize them. They aren't setups from my recaps, so treat them as examples to adapt and test them on a simulator before you trade them."
He has published no entry, stop (an order that exits a trade if price falls to a set level) or size for a pennant, so this page gives none for Kev. What follows is this page's own reading of how a long-only trader might look at a pennant, separate from his method.
First, the shape shrinks. The same guide says that "on a 5-minute chart they are compressed adaptations." Second, the nearest first-party idea is the flag. Our bull flag guide, which is written in the third person, says "Best entries are break + hold or break + retest of the flag high; avoid buying in the middle of the flag." Reading a pennant the same way is this page's translation: a long-only trader would wait for a close above the upper line and would skip the middle of the triangle.
Third, no source we found tests pennants on 1-minute or 5-minute charts, or on small caps, so anything you adapt belongs on a simulator first.
A hypothetical example with stop and size
This is made-up arithmetic on an invented stock. It is no real trade, no record of one and no signal. Kev has published no pennant entry or stop, so the numbers here are this page's own, applying his 1-2-3 rule.
The pattern. A stock runs from $4.00 to $5.00, so the pole is $1.00 tall. A pennant forms with a low of $4.70, and a candle closes above its upper line at $4.95. That close is the hypothetical entry.
The stop and the size. A stop below the pennant low at $4.65 gives $0.30 of risk per share. Investopedia describes this as the textbook place: "The stop-loss level is often set at the lowest point of the pennant pattern, since a breakdown from these levels would invalidate the pattern and could mark the beginning of a longer-term reversal." Momentum's stop loss guide adds a reminder: "A stop is a planning tool and carries no guarantee."
Momentum's chatroom page states the 1-2-3 rule: "The 1-2-3 rule: risk no more than 1% of the account, never enter without 2:1, and stop for the day after 3 losses." On a $25,000 account, 1% is $250. Momentum's position size guide gives the formula: "Position size is your dollar risk divided by your risk per share." Here that is $250 divided by $0.30, which is 833 shares rounded down, a planned loss of $249.90.
The two targets.
The same pennant clears the 2:1 minimum (a reward at least twice the risk) under one target and falls well short under the other, a factor of ten apart. Bulkowski's 35% belongs to his own measure rule, which is built from the pennant bottom, and says nothing about the $5.95 full-pole target. The example shows that the target is a planning assumption that changes the plan itself.
When does a bull pennant fail?
A bull pennant fails in a few predictable ways. There is no pole: our trend continuations guide lists "No sudden move before it (no flagpole)" as a case where a pause is not a continuation. The triangle is loose or tilted the way the pole ran, which Bulkowski's two cautions above warn against. Volume fails to return on the break, and Investopedia lists lack of volume among the reasons pennants fail. You enter inside the triangle, and the apex arrives with nothing broken, or price closes below the lower line and the shape is over. Or it drags on: past Bulkowski's three weeks (or minutes, on a fast chart), the shape is probably a symmetrical triangle or a wedge.
A close below the pennant low is the textbook invalidation, and for a long-only trader it means no long.
Bull pennant pattern: frequently asked questions
What is a bull pennant pattern?
It is a continuation pattern made of a steep flagpole, a small symmetrical triangle of converging lines on fading volume, and a breakout above the upper line.
How long does a bull pennant last?
It depends on the source. Bulkowski says 3 weeks or less. Investopedia says commonly one to three weeks. StockCharts says one to 12 weeks, ideally one to four. On a small-cap morning chart, Momentum's trend continuations guide says the shapes form in minutes.
Is a pennant always bullish?
No. The pole sets the direction, and the mirror shape after a decline is a bear pennant. In Bulkowski's data, which covers pennants after any trend, the breakout went upward 57% of the time, so a close above the upper line is the evidence.
What is the difference between a bull pennant and a bull flag?
The lines. A pennant has converging lines that form a small triangle, and a flag has parallel lines that form a rectangle.
What does Bulkowski's data say about pennants?
In his bull-market sample, statistics dated 27 Aug 2020, 54% of upward breakouts failed to rise at least 5%, the average rise was 7%, and 35% met the price target. His page does not state a chart timeframe, and it measures price swings in Bulkowski's sample, which are separate from day-trading win rates.
Can you trade a pennant on a 5-minute chart?
We found no data either way, because no source we read tests pennants on 5-minute charts. Kev lists the pennant as a textbook pattern he includes so you recognize it, apart from his recap setups, and says to adapt it and test it on a simulator first.
Watch the open with Kev
Kev trades the open live on stream in the Momentum trading room and calls out his entry and his stop as he takes each trade. Membership includes the live stream, the Momentum Scanner, the Momentum Journal and the nightly and pre-market watchlists. Start your 7-day free trial. Free for 7 days, then $197 a month. Cancel anytime.
This content is for educational purposes only and is not financial advice. Trading involves significant risk and may not be suitable for all traders.