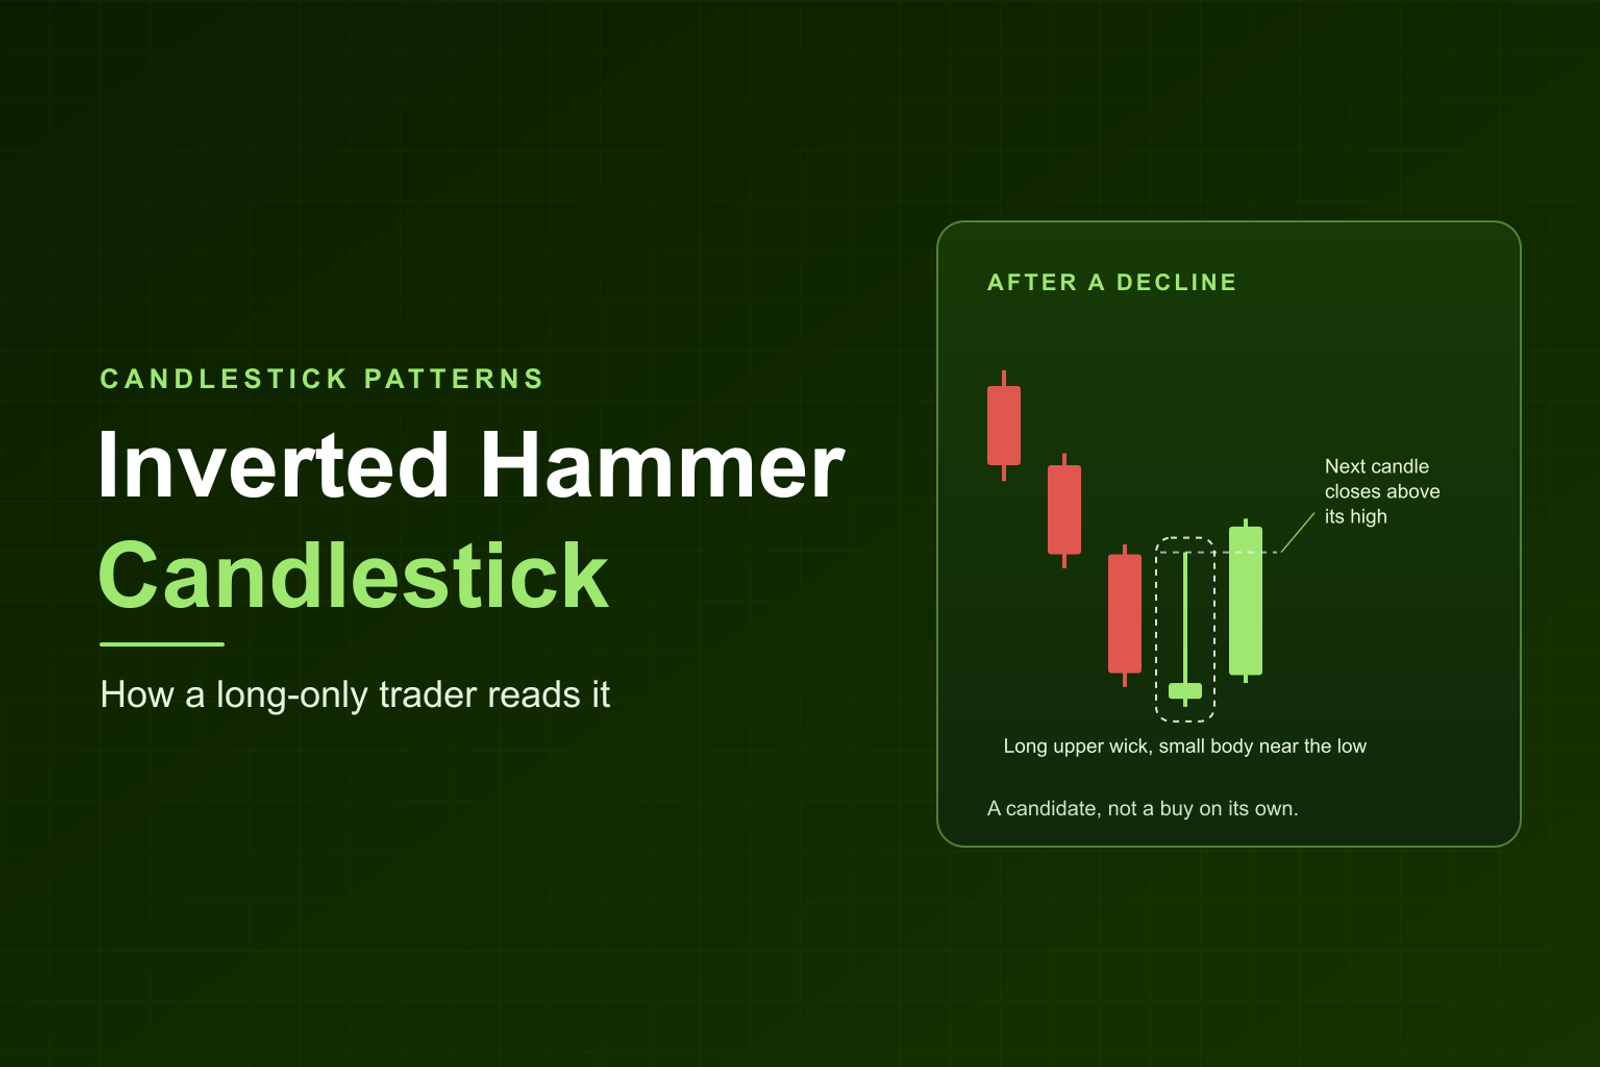
Short answer: An inverted hammer is a candle that forms after a decline, with a small body near the low of its range, a long upper wick at least twice the body, and little or no lower wick. It reads as a possible turn and a candidate for a long, and the next candle decides whether it is one. The long upper wick is buying that pushed price up and failed to hold it. Almost every top Google result calls it a bullish reversal, a turn from falling to rising. The researcher Thomas Bulkowski, who tests his own two-line version on daily charts, finds a bearish continuation (price keeps falling) 65% of the time. That is not a win rate, and it does not describe the one-candle shape.
Kev (Kevin Cabana, who runs the Momentum trading room) trades long only: every trade he takes buys a stock he expects to rise. So this page asks what an inverted hammer means for someone holding or planning a long. It goes deeper than our guide to candlestick patterns. A stop is the price where you exit a trade that goes against you. A stock in play is a stock already moving on heavy volume. A level is a price traders already watch, such as support or a premarket high. A doji is a candle whose body is 5% of its range or less, the line Investopedia uses. A 2:1 reward to risk means the target sits twice as far from your entry as your stop. A candle's body is the span between its open and close, a wick is the thin line above or below the body, the range is its high minus its low, and the close is its last price.
What is an inverted hammer candlestick?
An inverted hammer is the hammer turned upside down: a small body near the bottom of the candle and a long wick above it. Price opened low, buyers pushed it well higher, and sellers pushed it back to near the open.
Sources split on how many candles make the pattern, and that matters for every number here.
- One candle. StockCharts calls it "A one-day bullish reversal pattern" in its pattern dictionary. Commodity.com, CMC Markets and LuxAlgo also describe one candle, and so do the sister pages here.
- Two lines. Bulkowski writes: "A hammer is a single candle line in a downtrend, but an inverted hammer is a two line candle, also in a downtrend." His version is a tall black candle (a candle that closes below its open) with a close near its low, then a short candle with a tall upper shadow and little or no lower shadow. The second candle cannot be a doji, and it opens below the first candle's close. thinkorswim and Huntraders also describe two candles.
The one-candle shape is the second line on its own. This page uses it for the shape and says "Bulkowski's two-line version" for his test.
Is it an inverted hammer?
Five checks decide whether a candle has the shape. Color is the one you can relax.
The last row is this page's day-trading addition, and it matters most. Kev's roundup of reliable patterns says: "A hammer or engulfing candle earns attention only at a level on a stock in play." That line names the hammer and the engulfing candle. Applying the same rule to an inverted hammer is this page's reading.
What does the inverted hammer say about buyers and sellers?
Sellers had control, since the stock had been falling. Buyers then drove price up through the range, and by the close sellers had taken most of it back. So the long upper wick shows that buyers exist at that price and that they could not hold it.
StockCharts puts it this way: "These candlesticks mark potential trend reversals but require confirmation before action." Commodity.com is plainer: "It is important to note that the Inverted pattern is a warning of potential price change, not a signal, by itself, to buy." The candle is a question, and the next candle answers it. Our shooting star page uses the framing this page keeps: "A candidate for a long at a level."
Is an inverted hammer bullish or bearish?
The textbook answer is bullish. StockCharts files it as a bullish reversal, and Bulkowski's own results page lists the theory: "Theoretical performance: Bullish reversal."
The tested answer is different. On his daily charts, for his two-line version, Bulkowski reports: "Tested performance: Bearish continuation 65% of the time." Here is what each part means.
- Continuation. In his glossary, a continuation is when "price enters and exits a chart pattern in the same direction." Price came in falling and left falling. Neither word is a profit or a loss.
- Why it happens. He says "price has to close above the top of the candle pattern, and that is more rare than a downward breakout."
- The ranks. His frequency rank (how often the pattern appears) is 61 and his overall performance rank is 6, "out of 103" candlestick patterns, where rank 1 is best. The overall rank describes how big the move tends to be after a breakout, with up and down breakouts counted together, so it does not measure bullishness. It is a performance rank and says nothing about how often the pattern reverses.
- The scope. His page says only that the numbers rest on "hundreds of perfect trades" and prints no data date, and the statistics come from daily charts. His caution on the shooting star page applies here too: "my statistics are based on the daily charts, not intra day ones."
Bulkowski tested a two-line pattern, and no source in this research publishes a number for the one-candle shape, so his figure cannot label the shape bearish. His result shows that "bullish reversal" is a textbook theory and why the next candle matters so much.
Inverted hammer vs shooting star
They are the same shape with a different history. StockCharts says: "The Inverted Hammer and Shooting Star look identical but have different implications based on previous price action." Our shooting star page puts it in one line: "After a decline it is an inverted hammer. After a rally it is a shooting star."
Our shooting star candlestick page covers the held long.
Inverted hammer vs hammer, hanging man and gravestone doji
The hammer's long wick sits below the body and the inverted hammer's sits above it. A gravestone doji has a body of 5% of the range or less. Every percentage in the table counts which way price left Bulkowski's pattern on daily charts, and none is a win rate.
What else does Bulkowski say about it?
These are tips from his Encyclopedia of Candlestick Charts, and his statistics are on daily charts. None of this is a win rate. Two of his tips for the pattern, each quoted on its own: "Inverted hammer candles with tall shadows often perform well" and "Inverted hammers within a third of the yearly low often act as continuations of the existing price trend." The first does not say whether "perform well" means a rise or a fall, and the second is a reason for care near a yearly low. He also writes: "A morning star is similar to an inverted hammer but has a confirming candle." Our morning star candlestick page covers it.
Academic work does not settle it either. Two studies, read by abstract, found no predictive power on intraday DAX and Bund futures (2005) and no general profitability on large US stocks (2007). Neither names the inverted hammer. A third study, on Dow Jones stocks from 1974 to 2009, found several one-day patterns may well prove profitable (2016), and its abstract does not name the inverted hammer either.
How do you confirm an inverted hammer?
Confirmation is a later candle that shows buyers came back. This page uses the rule our hammer page uses: wait for a close above its high, and skip it with no level.
- Wait for the next candle. LuxAlgo describes "a bullish close or gap up on the following candle."
- Close above the high. The high is the top of the wick. A close above it means price passed the point where sellers took over, which echoes Bulkowski's rule that price has to close above the top of the pattern, though his top covers both candles.
- Know the looser reading. CMC Markets accepts "a subsequent candle that closes above the inverted hammer's body." That textbook version fires sooner, which is why this page uses the high.
- Look for a level and volume. LuxAlgo suggests a candle that prints "into mapped support," and CMC Markets lists "Higher volume on the confirming candle." Treat both as context only.
What does a long-only trader do with an inverted hammer?
Nothing, until a later candle gives a reason. The inverted hammer needs a later candle before it is anything to act on. It matters at a level on a stock in play and almost nowhere else, the rule Kev gives for a hammer or engulfing candle, applied here as this page's reading. The order this page uses:
- Find the level. Is the wick at support, a premarket low or a level the stock held earlier?
- Check the stock. Is it in play, with volume and a reason to move?
- Wait for a close above the high. No close above the wick, no setup. A close above it makes the candle a candidate, and the stop comes before any entry.
- Define the risk. In this page's example the stop sits one cent under the inverted hammer's low, and Kev has not said where his stop goes on this setup. If any answer is no, skip it.
Kev allows three triggers on his pullback trading strategy page, and none is named inverted hammer. His second is "Trigger 2: Higher low confirmed by a breakout candle." A confirming candle that closes above the wick's high is structurally close to it, since it is a strong close above the prior candle's high. That mapping is this page's own, and Kev has not labeled it so. His trigger 3, a "Rejection wick followed by immediate recovery," is a wick on the low side, the hammer's shape.
Kev's 1-2-3 rule is: "risk no more than 1% of the account, never enter without 2:1, and stop for the day after 3 losses." A stop is a planning tool and carries no guarantee. His exit rule, "price tries to break out and instantly rejects (topping tail) = full exit, every single time, no exceptions," is about a breakout that rejects on a long he already holds. The same long wick means one thing there and another on a stock that has already fallen.
A hypothetical worked example
Every number here is made up, on a made-up stock. This is a hypothetical that computes risk only. It is not a trade, and it shows no forecast and no result.
On a 5-minute chart, a stock in play has sold off to a level it held earlier. Candle 1 is red: it opens at $4.30, trades from $3.98 to $4.31, and closes at $4.00. Candle 2 opens at $3.97, below candle 1's close, trades from $3.96 to $4.10, and closes at $3.99. Candle 3 opens at $3.99, trades from $3.98 to $4.14, and closes at $4.12, above candle 2's high of $4.10.
Candle 2's body is $0.02 and its upper wick is $0.11, 5.5 times the body, so it passes the "at least twice" line. Its lower wick is $0.01. The range is $0.14, so the body is about 14% of the range, which rules out a gravestone doji.
Now the risk. A long is taken on candle 3's close at $4.12, with the stop one cent under candle 2's low at $3.95. The risk is $0.17 a share. On a $10,000 account, the 1% in Kev's 1-2-3 rule is $100 of risk. Our position size guide gives the formula: "Position size is your dollar risk divided by your risk per share." So the size is $100 divided by $0.17, which is 588 shares after rounding down, planning $99.96 of risk. The 2:1 floor puts the first target at $4.46, which is $4.12 plus two times $0.17.
By Bulkowski's two-line reading, candle 3 is not an upward breakout, because his rule asks for a close above the top of the whole pattern and candle 1's high was $4.31. That is this page's reading of his wording. After the entry, the setup has failed if price trades down to the $3.95 stop. A fast stock can fill below a stop.
When does an inverted hammer fail?
- Entering on the candle itself. CMC Markets notes that "Many inverted hammers fail to produce reversals, and prices continue lower."
- Reading "bullish reversal" as a tested result. The only tested figure this page found points the other way.
Inverted hammer candlestick: frequently asked questions
What is an inverted hammer candlestick?
A candle after a decline with a small body near the low of its range, a long upper wick at least twice the body and little or no lower wick. Bulkowski's version has two lines.
Is an inverted hammer bullish or bearish?
The textbook calls it a bullish reversal, and it is a candidate for a long at a level once a later candle closes above its high. Bulkowski tested his two-line version on daily charts and found a bearish continuation (price keeps falling) 65% of the time. That counts which way price left his pattern and says nothing about any trader's results. The one-candle shape has no figure on his inverted hammer page, so the next candle decides.
Is a green inverted hammer bullish or bearish?
Either color is a candidate for a long at a level once a later candle closes above its high. Commodity.com says green is stronger with no statistic behind it, and LuxAlgo says color matters little.
What is the difference between a hammer and an inverted hammer?
A hammer has its long wick below the body and an inverted hammer above it. Bulkowski finds a bullish reversal 60% of the time for the hammer on daily charts. That counts upward breakouts above the candle and says nothing about any trader's results. See our hammer candlestick page.
What is the difference between an inverted hammer and a shooting star?
Only the trend before the candle. After a decline it is an inverted hammer, and after a rally it is a shooting star.
What confirms an inverted hammer?
A later candle that closes above its high. A looser textbook reading accepts a close above the body. With no level, skip it.
Does an inverted hammer work on a 5-minute chart?
Bulkowski's statistics are based on daily charts, so they do not tell you how it behaves on a 5-minute chart. On this page's reading, it matters there only at a level on a stock in play.
Watch the open with Kev
Kev trades the open live on stream in the Momentum trading room and calls out his entry and his stop as he takes each trade, so you see the thought process behind every decision. Membership includes the live stream and its recordings, the Momentum Scanner, the Momentum Journal, and the nightly and pre-market watchlists. Start your 7-day free trial. Free for 7 days, then $197 a month. Cancel anytime.
This content is for educational purposes only and is not financial advice. Trading involves significant risk and may not be suitable for all traders.